RussellMidcap IWS full analysis,charts,indicators,moving averages,SMA,DMA,EMA,ADX,MACD,RSIRussell Midcap IWS WideScreen charts, DMA,SMA,EMA technical analysis, forecast prediction, by indicators ADX,MACD,RSI,CCI AMEX stock exchange
Daily price and charts and targets RussellMidcap Strong Daily Stock price targets for RussellMidcap IWS are 139.35 and 140.84 | Daily Target 1 | 138.15 | | Daily Target 2 | 139.05 | | Daily Target 3 | 139.64333333333 | | Daily Target 4 | 140.54 | | Daily Target 5 | 141.13 |
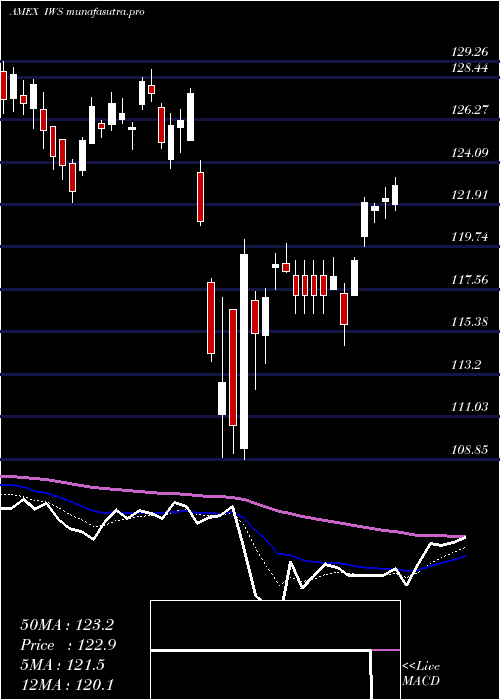
Daily price and volume Russell Midcap
| Date |
Closing |
Open |
Range |
Volume |
Thu 23 October 2025 |
139.94 (0.79%) |
139.28 |
138.75 - 140.24 |
0.8034 times |
Wed 22 October 2025 |
138.85 (-0.69%) |
139.68 |
138.31 - 140.08 |
0.724 times |
Tue 21 October 2025 |
139.82 (0.32%) |
139.20 |
139.01 - 140.33 |
0.6347 times |
Mon 20 October 2025 |
139.38 (1.18%) |
138.59 |
138.59 - 139.54 |
0.4421 times |
Fri 17 October 2025 |
137.75 (0.31%) |
136.99 |
136.87 - 137.94 |
1.8794 times |
Thu 16 October 2025 |
137.33 (-1.19%) |
139.17 |
136.79 - 139.23 |
2.3946 times |
Wed 15 October 2025 |
138.98 (0.33%) |
139.21 |
137.82 - 140.07 |
0.5819 times |
Tue 14 October 2025 |
138.52 (0.9%) |
136.05 |
136.05 - 139.21 |
0.7306 times |
Mon 13 October 2025 |
137.28 (-1.85%) |
136.91 |
136.58 - 137.78 |
1.2276 times |
Tue 07 October 2025 |
139.87 (-0.63%) |
141.20 |
139.57 - 141.34 |
0.5816 times |
Mon 06 October 2025 |
140.75 (-0.13%) |
141.56 |
140.56 - 141.56 |
0.3375 times |
Weekly price and charts RussellMidcap Strong weekly Stock price targets for RussellMidcap IWS are 139.13 and 141.15 | Weekly Target 1 | 137.51 | | Weekly Target 2 | 138.72 | | Weekly Target 3 | 139.52666666667 | | Weekly Target 4 | 140.74 | | Weekly Target 5 | 141.55 |
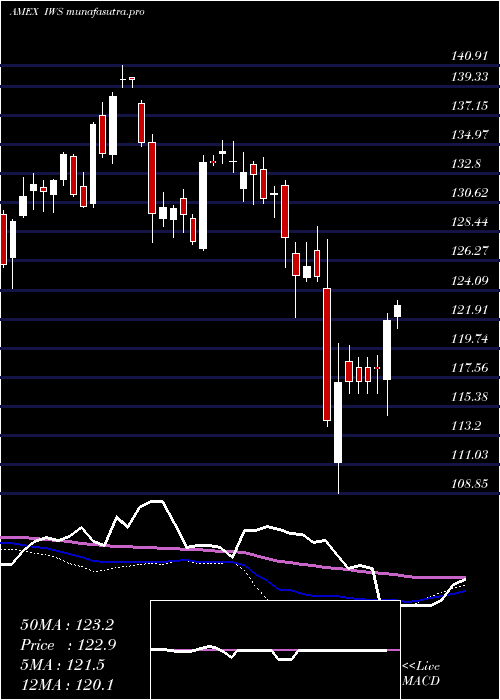
Weekly price and volumes for Russell Midcap
| Date |
Closing |
Open |
Range |
Volume |
Thu 23 October 2025 |
139.94 (1.59%) |
138.59 |
138.31 - 140.33 |
0.5633 times |
Fri 17 October 2025 |
137.75 (-1.52%) |
136.91 |
136.05 - 140.07 |
1.4739 times |
Tue 07 October 2025 |
139.87 (-0.75%) |
141.56 |
139.57 - 141.56 |
0.1988 times |
Fri 03 October 2025 |
140.93 (1.47%) |
139.55 |
138.51 - 141.68 |
0.7109 times |
Fri 26 September 2025 |
138.89 (0.12%) |
138.30 |
136.90 - 139.99 |
0.9786 times |
Fri 19 September 2025 |
138.72 (-0.49%) |
139.76 |
137.52 - 140.36 |
2.8536 times |
Fri 12 September 2025 |
139.41 (0.18%) |
139.29 |
138.00 - 140.76 |
1.5964 times |
Fri 05 September 2025 |
139.16 (0.41%) |
137.31 |
136.75 - 140.26 |
0.8914 times |
Fri 29 August 2025 |
138.59 (0%) |
138.77 |
138.20 - 139.24 |
0.1686 times |
Fri 29 August 2025 |
138.59 (-0.4%) |
138.80 |
137.99 - 139.24 |
0.5645 times |
Fri 22 August 2025 |
139.14 (2.24%) |
136.11 |
135.31 - 139.54 |
1.1492 times |
Monthly price and charts RussellMidcap Strong monthly Stock price targets for RussellMidcap IWS are 138 and 143.63 | Monthly Target 1 | 133.59 | | Monthly Target 2 | 136.77 | | Monthly Target 3 | 139.22333333333 | | Monthly Target 4 | 142.4 | | Monthly Target 5 | 144.85 |
Monthly price and volumes Russell Midcap
| Date |
Closing |
Open |
Range |
Volume |
Thu 23 October 2025 |
139.94 (0.19%) |
139.23 |
136.05 - 141.68 |
0.4609 times |
Tue 30 September 2025 |
139.67 (0.78%) |
137.31 |
136.75 - 140.76 |
1.2012 times |
Fri 29 August 2025 |
138.59 (2.99%) |
133.54 |
131.46 - 139.54 |
0.7256 times |
Thu 31 July 2025 |
134.57 (1.84%) |
131.77 |
131.77 - 137.56 |
0.9835 times |
Mon 30 June 2025 |
132.14 (3.13%) |
127.82 |
126.48 - 132.33 |
0.8881 times |
Fri 30 May 2025 |
128.13 (4.38%) |
122.94 |
122.29 - 131.02 |
0.9904 times |
Wed 30 April 2025 |
122.75 (-2.56%) |
125.85 |
108.85 - 127.84 |
1.975 times |
Mon 31 March 2025 |
125.97 (-4.06%) |
131.91 |
122.01 - 132.31 |
1.1161 times |
Fri 28 February 2025 |
131.30 (-1.8%) |
131.68 |
129.50 - 134.39 |
0.6803 times |
Fri 31 January 2025 |
133.70 (3.37%) |
130.14 |
127.08 - 135.32 |
0.979 times |
Tue 31 December 2024 |
129.34 (-7.54%) |
138.07 |
127.64 - 138.30 |
0.7684 times |

DMA SMA EMA moving averages of Russell Midcap IWS
DMA (daily moving average) of Russell Midcap IWS
| DMA period | DMA value | | 5 day DMA | 139.15 | | 12 day DMA | 139.12 | | 20 day DMA | 139.11 | | 35 day DMA | 138.97 | | 50 day DMA | 138.49 | | 100 day DMA | 135.53 | | 150 day DMA | 131.46 | | 200 day DMA | 131.36 | EMA (exponential moving average) of Russell Midcap IWS
| EMA period | EMA current | EMA prev | EMA prev2 | | 5 day EMA | 139.28 | 138.95 | 139 | | 12 day EMA | 139.1 | 138.95 | 138.97 | | 20 day EMA | 139 | 138.9 | 138.91 | | 35 day EMA | 138.6 | 138.52 | 138.5 | | 50 day EMA | 138.19 | 138.12 | 138.09 |
SMA (simple moving average) of Russell Midcap IWS
| SMA period | SMA current | SMA prev | SMA prev2 | | 5 day SMA | 139.15 | 138.63 | 138.65 | | 12 day SMA | 139.12 | 139.14 | 139.22 | | 20 day SMA | 139.11 | 139.05 | 139.04 | | 35 day SMA | 138.97 | 138.93 | 138.93 | | 50 day SMA | 138.49 | 138.36 | 138.26 | | 100 day SMA | 135.53 | 135.42 | 135.3 | | 150 day SMA | 131.46 | 131.36 | 131.26 | | 200 day SMA | 131.36 | 131.31 | 131.26 |
|
|
