RussellMidcap IWR full analysis,charts,indicators,moving averages,SMA,DMA,EMA,ADX,MACD,RSIRussell Midcap IWR WideScreen charts, DMA,SMA,EMA technical analysis, forecast prediction, by indicators ADX,MACD,RSI,CCI AMEX stock exchange
Daily price and charts and targets RussellMidcap Strong Daily Stock price targets for RussellMidcap IWR are 96.39 and 97.41 | Daily Target 1 | 95.57 | | Daily Target 2 | 96.19 | | Daily Target 3 | 96.593333333333 | | Daily Target 4 | 97.21 | | Daily Target 5 | 97.61 |
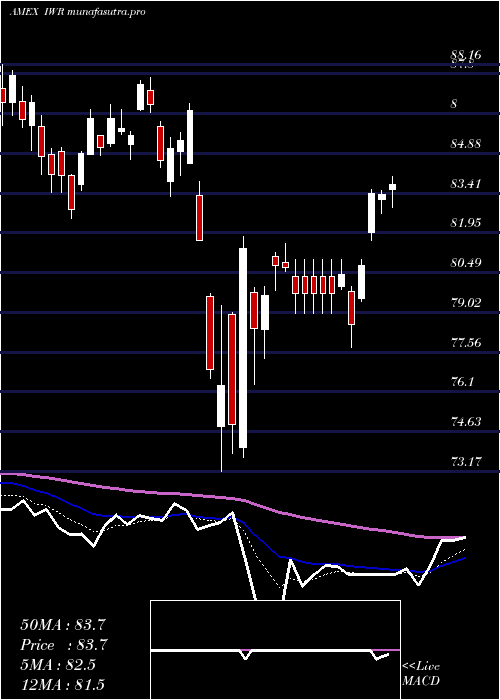
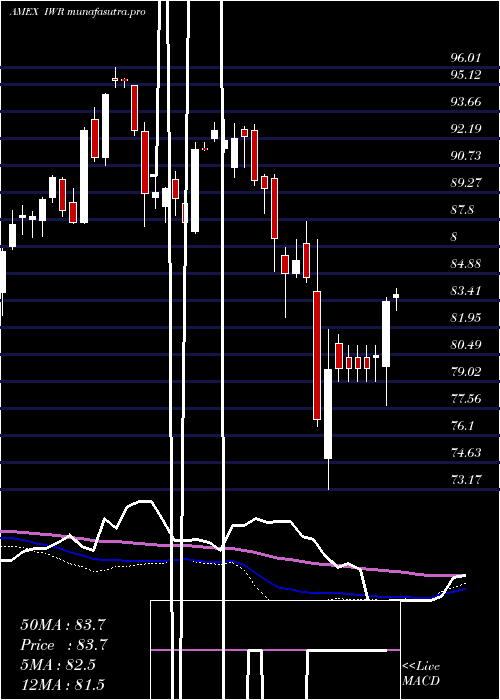
Daily price and volume Russell Midcap
| Date |
Closing |
Open |
Range |
Volume |
Thu 23 October 2025 |
96.80 (0.88%) |
96.16 |
95.98 - 97.00 |
2.309 times |
Wed 22 October 2025 |
95.96 (-0.87%) |
96.79 |
95.50 - 96.92 |
1.0093 times |
Tue 21 October 2025 |
96.80 (0.43%) |
96.39 |
96.13 - 97.07 |
0.6657 times |
Mon 20 October 2025 |
96.39 (1.14%) |
96.80 |
95.91 - 96.80 |
0.5205 times |
Fri 17 October 2025 |
95.30 (0.23%) |
94.85 |
94.64 - 95.46 |
0.8955 times |
Thu 16 October 2025 |
95.08 (-1.2%) |
96.52 |
94.74 - 96.52 |
1.3581 times |
Wed 15 October 2025 |
96.23 (0.28%) |
96.62 |
95.45 - 97.14 |
0.7016 times |
Tue 14 October 2025 |
95.96 (0.72%) |
94.34 |
94.30 - 96.50 |
1.3113 times |
Mon 13 October 2025 |
95.27 (-1.44%) |
94.92 |
94.77 - 95.56 |
0.7264 times |
Tue 07 October 2025 |
96.66 (-0.66%) |
97.50 |
96.28 - 97.56 |
0.5026 times |
Mon 06 October 2025 |
97.30 (0.07%) |
97.60 |
97.05 - 97.75 |
0.619 times |
Weekly price and charts RussellMidcap Strong weekly Stock price targets for RussellMidcap IWR are 96.02 and 97.59 | Weekly Target 1 | 94.89 | | Weekly Target 2 | 95.84 | | Weekly Target 3 | 96.456666666667 | | Weekly Target 4 | 97.41 | | Weekly Target 5 | 98.03 |
Weekly price and volumes for Russell Midcap
| Date |
Closing |
Open |
Range |
Volume |
Thu 23 October 2025 |
96.80 (1.57%) |
96.80 |
95.50 - 97.07 |
1.4445 times |
Fri 17 October 2025 |
95.30 (-1.41%) |
94.92 |
94.30 - 97.14 |
1.6011 times |
Tue 07 October 2025 |
96.66 (-0.59%) |
97.60 |
96.28 - 97.75 |
0.3597 times |
Fri 03 October 2025 |
97.23 (1.11%) |
96.72 |
95.75 - 97.80 |
1.018 times |
Fri 26 September 2025 |
96.16 (-0.24%) |
96.16 |
94.76 - 97.15 |
1.0605 times |
Fri 19 September 2025 |
96.39 (-0.33%) |
96.97 |
95.32 - 97.31 |
1.2301 times |
Fri 12 September 2025 |
96.71 (0.36%) |
96.53 |
95.73 - 97.59 |
1.1269 times |
Fri 05 September 2025 |
96.36 (0.31%) |
95.02 |
94.73 - 97.14 |
0.8998 times |
Fri 29 August 2025 |
96.06 (0%) |
96.31 |
95.74 - 96.56 |
0.1793 times |
Fri 29 August 2025 |
96.06 (-0.06%) |
95.98 |
95.44 - 96.56 |
1.0801 times |
Fri 22 August 2025 |
96.12 (2.03%) |
94.22 |
93.62 - 96.43 |
1.1286 times |
Monthly price and charts RussellMidcap Strong monthly Stock price targets for RussellMidcap IWR are 95.55 and 99.05 | Monthly Target 1 | 92.8 | | Monthly Target 2 | 94.8 | | Monthly Target 3 | 96.3 | | Monthly Target 4 | 98.3 | | Monthly Target 5 | 99.8 |
Monthly price and volumes Russell Midcap
| Date |
Closing |
Open |
Range |
Volume |
Thu 23 October 2025 |
96.80 (0.26%) |
96.34 |
94.30 - 97.80 |
0.7004 times |
Tue 30 September 2025 |
96.55 (0.51%) |
95.02 |
94.73 - 97.59 |
0.8587 times |
Fri 29 August 2025 |
96.06 (2.51%) |
92.77 |
91.36 - 96.56 |
0.8695 times |
Thu 31 July 2025 |
93.71 (1.89%) |
91.79 |
91.45 - 95.42 |
1.2394 times |
Mon 30 June 2025 |
91.97 (3.38%) |
88.65 |
87.69 - 92.13 |
0.79 times |
Fri 30 May 2025 |
88.96 (5.72%) |
84.46 |
83.94 - 90.74 |
1.0889 times |
Wed 30 April 2025 |
84.15 (-1.08%) |
84.96 |
73.17 - 86.70 |
1.8255 times |
Mon 31 March 2025 |
85.07 (-4.91%) |
90.00 |
82.47 - 90.24 |
1.2148 times |
Fri 28 February 2025 |
89.46 (-2.83%) |
90.61 |
88.12 - 93.01 |
0.5834 times |
Fri 31 January 2025 |
92.07 (4.15%) |
89.03 |
87.01 - 93.21 |
0.8293 times |
Tue 31 December 2024 |
88.40 (-7.27%) |
95.06 |
87.43 - 95.06 |
0.8668 times |

DMA SMA EMA moving averages of Russell Midcap IWR
DMA (daily moving average) of Russell Midcap IWR
| DMA period | DMA value | | 5 day DMA | 96.25 | | 12 day DMA | 96.25 | | 20 day DMA | 96.26 | | 35 day DMA | 96.27 | | 50 day DMA | 95.92 | | 100 day DMA | 93.98 | | 150 day DMA | 90.71 | | 200 day DMA | 90.5 | EMA (exponential moving average) of Russell Midcap IWR
| EMA period | EMA current | EMA prev | EMA prev2 | | 5 day EMA | 96.35 | 96.12 | 96.2 | | 12 day EMA | 96.25 | 96.15 | 96.18 | | 20 day EMA | 96.21 | 96.15 | 96.17 | | 35 day EMA | 95.94 | 95.89 | 95.89 | | 50 day EMA | 95.72 | 95.68 | 95.67 |
SMA (simple moving average) of Russell Midcap IWR
| SMA period | SMA current | SMA prev | SMA prev2 | | 5 day SMA | 96.25 | 95.91 | 95.96 | | 12 day SMA | 96.25 | 96.26 | 96.31 | | 20 day SMA | 96.26 | 96.24 | 96.26 | | 35 day SMA | 96.27 | 96.25 | 96.25 | | 50 day SMA | 95.92 | 95.84 | 95.78 | | 100 day SMA | 93.98 | 93.91 | 93.82 | | 150 day SMA | 90.71 | 90.64 | 90.57 | | 200 day SMA | 90.5 | 90.47 | 90.43 |
|
|
