RussellMidcap IWP full analysis,charts,indicators,moving averages,SMA,DMA,EMA,ADX,MACD,RSIRussell Midcap IWP WideScreen charts, DMA,SMA,EMA technical analysis, forecast prediction, by indicators ADX,MACD,RSI,CCI AMEX stock exchange
Daily price and charts and targets RussellMidcap Strong Daily Stock price targets for RussellMidcap IWP are 142.48 and 144.33 | Daily Target 1 | 140.97 | | Daily Target 2 | 142.13 | | Daily Target 3 | 142.82333333333 | | Daily Target 4 | 143.98 | | Daily Target 5 | 144.67 |
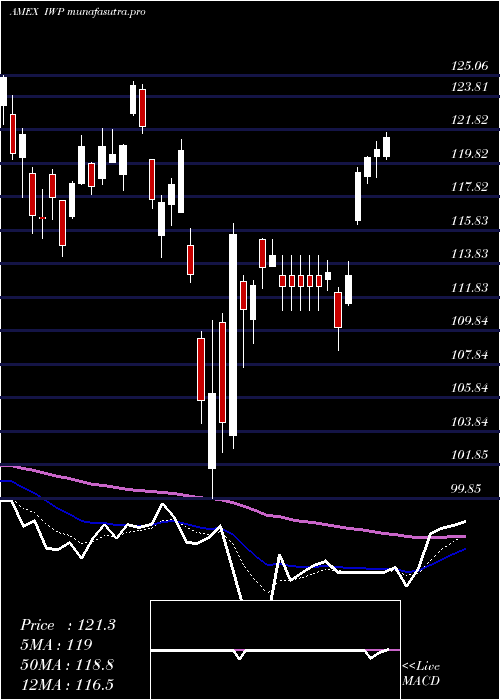
Daily price and volume Russell Midcap
| Date |
Closing |
Open |
Range |
Volume |
Thu 23 October 2025 |
143.28 (1.24%) |
141.67 |
141.67 - 143.52 |
0.4202 times |
Wed 22 October 2025 |
141.53 (-1.35%) |
143.62 |
140.46 - 143.62 |
0.7739 times |
Tue 21 October 2025 |
143.47 (0.6%) |
142.54 |
142.00 - 143.70 |
0.707 times |
Mon 20 October 2025 |
142.62 (1.01%) |
140.61 |
140.61 - 143.04 |
0.5435 times |
Fri 17 October 2025 |
141.20 (-0.01%) |
140.53 |
139.79 - 141.65 |
3.0305 times |
Thu 16 October 2025 |
141.21 (-1.22%) |
143.47 |
140.59 - 143.79 |
2.257 times |
Wed 15 October 2025 |
142.96 (0.29%) |
143.86 |
141.91 - 144.77 |
0.3366 times |
Tue 14 October 2025 |
142.55 (0.27%) |
140.46 |
139.69 - 143.64 |
0.4594 times |
Mon 13 October 2025 |
142.16 (-0.25%) |
141.30 |
141.16 - 142.51 |
0.5446 times |
Tue 07 October 2025 |
142.52 (-0.75%) |
143.99 |
141.18 - 143.99 |
0.9273 times |
Mon 06 October 2025 |
143.59 (0.46%) |
143.85 |
142.75 - 144.52 |
0.682 times |
Weekly price and charts RussellMidcap Strong weekly Stock price targets for RussellMidcap IWP are 141.87 and 145.11 | Weekly Target 1 | 139.24 | | Weekly Target 2 | 141.26 | | Weekly Target 3 | 142.48 | | Weekly Target 4 | 144.5 | | Weekly Target 5 | 145.72 |
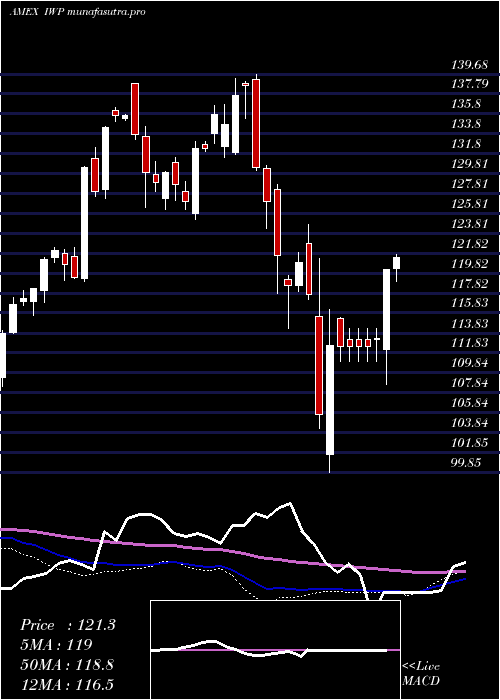
Weekly price and volumes for Russell Midcap
| Date |
Closing |
Open |
Range |
Volume |
Thu 23 October 2025 |
143.28 (1.47%) |
140.61 |
140.46 - 143.70 |
0.6621 times |
Fri 17 October 2025 |
141.20 (-0.93%) |
141.30 |
139.69 - 144.77 |
1.7952 times |
Tue 07 October 2025 |
142.52 (-0.29%) |
143.85 |
141.18 - 144.52 |
0.4359 times |
Fri 03 October 2025 |
142.93 (0.28%) |
143.53 |
141.22 - 143.98 |
0.7892 times |
Fri 26 September 2025 |
142.53 (-1.47%) |
143.97 |
140.04 - 145.33 |
1.1504 times |
Fri 19 September 2025 |
144.66 (0.3%) |
144.62 |
142.10 - 145.35 |
1.1188 times |
Fri 12 September 2025 |
144.23 (1.02%) |
143.26 |
142.65 - 145.50 |
1.0292 times |
Fri 05 September 2025 |
142.78 (-0.09%) |
140.72 |
140.25 - 143.97 |
1.2829 times |
Fri 29 August 2025 |
142.91 (0%) |
144.01 |
142.21 - 144.11 |
0.3143 times |
Fri 29 August 2025 |
142.91 (0.89%) |
141.56 |
140.70 - 144.17 |
1.4219 times |
Fri 22 August 2025 |
141.65 (1.28%) |
139.72 |
137.81 - 142.53 |
0.7704 times |
Monthly price and charts RussellMidcap Strong monthly Stock price targets for RussellMidcap IWP are 141.49 and 146.57 | Monthly Target 1 | 137.5 | | Monthly Target 2 | 140.39 | | Monthly Target 3 | 142.58 | | Monthly Target 4 | 145.47 | | Monthly Target 5 | 147.66 |
Monthly price and volumes Russell Midcap
| Date |
Closing |
Open |
Range |
Volume |
Thu 23 October 2025 |
143.28 (0.61%) |
141.91 |
139.69 - 144.77 |
0.6075 times |
Tue 30 September 2025 |
142.41 (-0.35%) |
140.72 |
140.04 - 145.50 |
0.9279 times |
Fri 29 August 2025 |
142.91 (1.05%) |
139.19 |
136.91 - 144.17 |
0.7805 times |
Thu 31 July 2025 |
141.42 (1.98%) |
137.98 |
136.27 - 143.83 |
0.9808 times |
Mon 30 June 2025 |
138.68 (4.32%) |
132.53 |
130.92 - 139.08 |
0.8434 times |
Fri 30 May 2025 |
132.94 (9.61%) |
122.47 |
121.63 - 135.20 |
0.8937 times |
Wed 30 April 2025 |
121.29 (3.23%) |
117.33 |
99.85 - 121.68 |
1.288 times |
Mon 31 March 2025 |
117.49 (-7.46%) |
128.23 |
114.19 - 128.64 |
1.2435 times |
Fri 28 February 2025 |
126.96 (-5.73%) |
131.88 |
124.26 - 139.68 |
1.2215 times |
Fri 31 January 2025 |
134.67 (6.25%) |
127.88 |
125.20 - 136.73 |
1.2132 times |
Tue 31 December 2024 |
126.75 (-6.49%) |
138.77 |
126.17 - 138.77 |
0.8639 times |

DMA SMA EMA moving averages of Russell Midcap IWP
DMA (daily moving average) of Russell Midcap IWP
| DMA period | DMA value | | 5 day DMA | 142.42 | | 12 day DMA | 142.5 | | 20 day DMA | 142.57 | | 35 day DMA | 143.07 | | 50 day DMA | 142.48 | | 100 day DMA | 140.12 | | 150 day DMA | 133.63 | | 200 day DMA | 132.77 | EMA (exponential moving average) of Russell Midcap IWP
| EMA period | EMA current | EMA prev | EMA prev2 | | 5 day EMA | 142.58 | 142.23 | 142.58 | | 12 day EMA | 142.56 | 142.43 | 142.59 | | 20 day EMA | 142.62 | 142.55 | 142.66 | | 35 day EMA | 142.38 | 142.33 | 142.38 | | 50 day EMA | 142.26 | 142.22 | 142.25 |
SMA (simple moving average) of Russell Midcap IWP
| SMA period | SMA current | SMA prev | SMA prev2 | | 5 day SMA | 142.42 | 142.01 | 142.29 | | 12 day SMA | 142.5 | 142.52 | 142.55 | | 20 day SMA | 142.57 | 142.67 | 142.83 | | 35 day SMA | 143.07 | 143.06 | 143.1 | | 50 day SMA | 142.48 | 142.38 | 142.33 | | 100 day SMA | 140.12 | 140.01 | 139.89 | | 150 day SMA | 133.63 | 133.48 | 133.33 | | 200 day SMA | 132.77 | 132.71 | 132.64 |
|
|
