Russell2000 IWN full analysis,charts,indicators,moving averages,SMA,DMA,EMA,ADX,MACD,RSIRussell 2000 IWN WideScreen charts, DMA,SMA,EMA technical analysis, forecast prediction, by indicators ADX,MACD,RSI,CCI AMEX stock exchange
Daily price and charts and targets Russell2000 Strong Daily Stock price targets for Russell2000 IWN are 178.48 and 180.81 | Daily Target 1 | 176.65 | | Daily Target 2 | 177.98 | | Daily Target 3 | 178.98 | | Daily Target 4 | 180.31 | | Daily Target 5 | 181.31 |
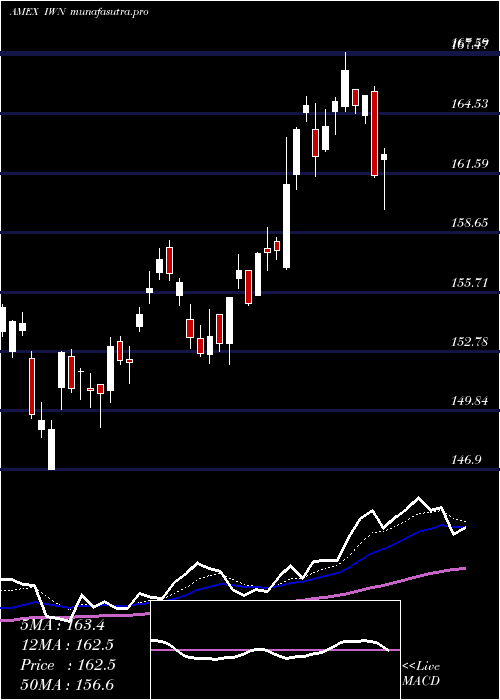
Daily price and volume Russell 2000
| Date |
Closing |
Open |
Range |
Volume |
Thu 23 October 2025 |
179.31 (0.96%) |
178.27 |
177.65 - 179.98 |
0.7376 times |
Wed 22 October 2025 |
177.61 (-0.96%) |
178.77 |
176.14 - 179.47 |
1.0081 times |
Tue 21 October 2025 |
179.34 (-0.44%) |
179.51 |
178.59 - 180.45 |
0.5789 times |
Mon 20 October 2025 |
180.13 (2.04%) |
178.62 |
178.20 - 180.39 |
0.9979 times |
Fri 17 October 2025 |
176.53 (-0.17%) |
175.82 |
175.58 - 177.39 |
1.2415 times |
Thu 16 October 2025 |
176.83 (-2.22%) |
181.21 |
176.03 - 181.23 |
1.6054 times |
Wed 15 October 2025 |
180.84 (0.75%) |
180.84 |
178.99 - 182.80 |
1.0802 times |
Tue 14 October 2025 |
179.50 (1.94%) |
174.30 |
174.01 - 180.51 |
0.9827 times |
Mon 13 October 2025 |
176.09 (-0.95%) |
174.89 |
174.10 - 176.34 |
0.8338 times |
Tue 07 October 2025 |
177.77 (-1.13%) |
180.41 |
177.28 - 180.41 |
0.9339 times |
Mon 06 October 2025 |
179.80 (0.2%) |
180.69 |
179.71 - 181.51 |
0.8522 times |
Weekly price and charts Russell2000 Strong weekly Stock price targets for Russell2000 IWN are 177.73 and 182.04 | Weekly Target 1 | 174.32 | | Weekly Target 2 | 176.82 | | Weekly Target 3 | 178.63333333333 | | Weekly Target 4 | 181.13 | | Weekly Target 5 | 182.94 |
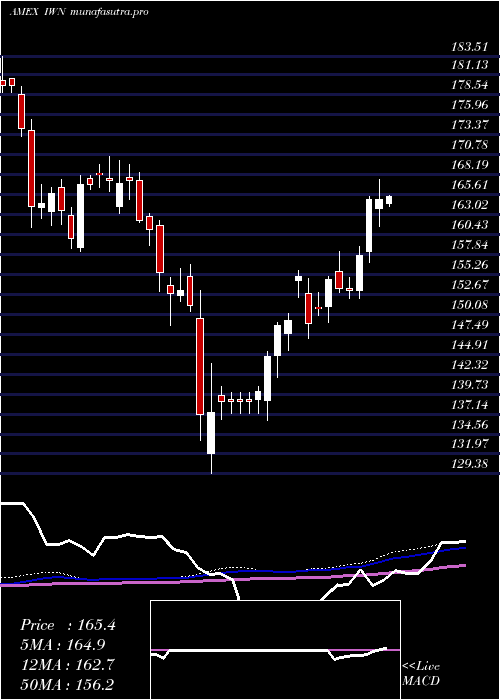
Weekly price and volumes for Russell 2000
| Date |
Closing |
Open |
Range |
Volume |
Thu 23 October 2025 |
179.31 (1.57%) |
178.62 |
176.14 - 180.45 |
0.7219 times |
Fri 17 October 2025 |
176.53 (-0.7%) |
174.89 |
174.01 - 182.80 |
1.2479 times |
Tue 07 October 2025 |
177.77 (-0.93%) |
180.69 |
177.28 - 181.51 |
0.3881 times |
Fri 03 October 2025 |
179.44 (1.57%) |
177.67 |
175.01 - 181.11 |
0.7867 times |
Fri 26 September 2025 |
176.66 (-0.14%) |
176.64 |
174.31 - 180.04 |
1.1225 times |
Fri 19 September 2025 |
176.90 (0.77%) |
176.20 |
174.04 - 179.45 |
1.634 times |
Fri 12 September 2025 |
175.55 (-0.26%) |
176.49 |
173.99 - 177.65 |
1.3109 times |
Fri 05 September 2025 |
176.00 (1.11%) |
171.87 |
171.62 - 177.70 |
1.3006 times |
Fri 29 August 2025 |
174.07 (0%) |
174.48 |
173.40 - 174.79 |
0.1817 times |
Fri 29 August 2025 |
174.07 (0.33%) |
173.08 |
172.03 - 175.20 |
1.3058 times |
Fri 22 August 2025 |
173.50 (4.14%) |
166.59 |
164.91 - 173.93 |
1.3206 times |
Monthly price and charts Russell2000 Strong monthly Stock price targets for Russell2000 IWN are 176.66 and 185.45 | Monthly Target 1 | 169.92 | | Monthly Target 2 | 174.61 | | Monthly Target 3 | 178.70666666667 | | Monthly Target 4 | 183.4 | | Monthly Target 5 | 187.5 |
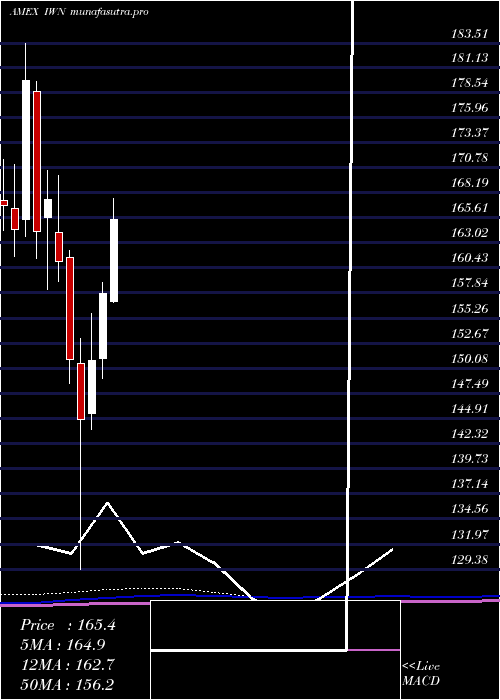
Monthly price and volumes Russell 2000
| Date |
Closing |
Open |
Range |
Volume |
Thu 23 October 2025 |
179.31 (1.41%) |
176.11 |
174.01 - 182.80 |
0.3679 times |
Tue 30 September 2025 |
176.81 (1.57%) |
171.87 |
171.62 - 180.04 |
0.7922 times |
Fri 29 August 2025 |
174.07 (8.53%) |
158.34 |
155.54 - 175.20 |
0.9193 times |
Thu 31 July 2025 |
160.39 (1.67%) |
156.95 |
156.84 - 167.82 |
1.3704 times |
Mon 30 June 2025 |
157.76 (4.59%) |
151.12 |
149.00 - 158.92 |
1.0317 times |
Fri 30 May 2025 |
150.83 (4.16%) |
145.44 |
143.78 - 155.75 |
1.1792 times |
Wed 30 April 2025 |
144.80 (-4.09%) |
150.59 |
129.38 - 153.14 |
1.5206 times |
Mon 31 March 2025 |
150.98 (-6.28%) |
161.54 |
148.53 - 162.22 |
0.9891 times |
Fri 28 February 2025 |
161.10 (-3.8%) |
164.11 |
159.04 - 169.98 |
0.8755 times |
Fri 31 January 2025 |
167.47 (2.01%) |
165.61 |
158.23 - 170.49 |
0.9541 times |
Tue 31 December 2024 |
164.17 (-8.67%) |
178.66 |
161.36 - 179.65 |
0.9316 times |
DMA SMA EMA moving averages of Russell 2000 IWN
DMA (daily moving average) of Russell 2000 IWN
| DMA period | DMA value | | 5 day DMA | 178.58 | | 12 day DMA | 178.6 | | 20 day DMA | 177.91 | | 35 day DMA | 176.95 | | 50 day DMA | 174.91 | | 100 day DMA | 167.13 | | 150 day DMA | 160.24 | | 200 day DMA | 160.96 | EMA (exponential moving average) of Russell 2000 IWN
| EMA period | EMA current | EMA prev | EMA prev2 | | 5 day EMA | 178.71 | 178.41 | 178.81 | | 12 day EMA | 178.37 | 178.2 | 178.31 | | 20 day EMA | 177.74 | 177.58 | 177.58 | | 35 day EMA | 175.94 | 175.74 | 175.63 | | 50 day EMA | 174.14 | 173.93 | 173.78 |
SMA (simple moving average) of Russell 2000 IWN
| SMA period | SMA current | SMA prev | SMA prev2 | | 5 day SMA | 178.58 | 178.09 | 178.73 | | 12 day SMA | 178.6 | 178.49 | 178.49 | | 20 day SMA | 177.91 | 177.81 | 177.78 | | 35 day SMA | 176.95 | 176.81 | 176.7 | | 50 day SMA | 174.91 | 174.54 | 174.21 | | 100 day SMA | 167.13 | 166.87 | 166.58 | | 150 day SMA | 160.24 | 160.08 | 159.91 | | 200 day SMA | 160.96 | 160.89 | 160.82 |
|
|
