Russell2000 IWM full analysis,charts,indicators,moving averages,SMA,DMA,EMA,ADX,MACD,RSIRussell 2000 IWM WideScreen charts, DMA,SMA,EMA technical analysis, forecast prediction, by indicators ADX,MACD,RSI,CCI AMEX stock exchange
Daily price and charts and targets Russell2000 Strong Daily Stock price targets for Russell2000 IWM are 250.18 and 254.3 | Daily Target 1 | 246.89 | | Daily Target 2 | 249.35 | | Daily Target 3 | 251.00666666667 | | Daily Target 4 | 253.47 | | Daily Target 5 | 255.13 |
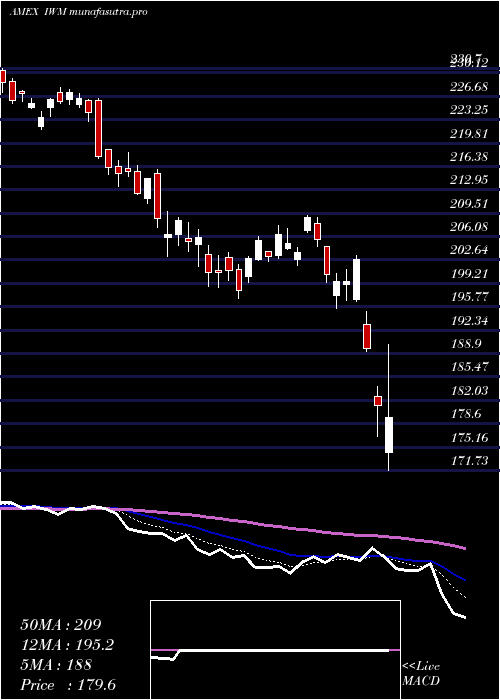
Daily price and volume Russell 2000
| Date |
Closing |
Open |
Range |
Volume |
Thu 04 December 2025 |
251.82 (0.88%) |
249.40 |
248.54 - 252.66 |
0.7376 times |
Wed 03 December 2025 |
249.63 (1.81%) |
245.97 |
245.48 - 249.84 |
0.7722 times |
Tue 02 December 2025 |
245.18 (-0.18%) |
246.51 |
245.12 - 247.55 |
0.5754 times |
Mon 01 December 2025 |
245.62 (-1.26%) |
245.57 |
245.34 - 247.69 |
0.8653 times |
Fri 28 November 2025 |
248.75 (0.58%) |
248.01 |
247.07 - 248.81 |
0.4446 times |
Wed 26 November 2025 |
247.32 (0.89%) |
245.97 |
244.77 - 248.83 |
0.6171 times |
Tue 25 November 2025 |
245.13 (2.18%) |
239.47 |
239.24 - 245.55 |
0.8219 times |
Mon 24 November 2025 |
239.90 (1.83%) |
237.04 |
235.18 - 240.39 |
0.5825 times |
Fri 21 November 2025 |
235.60 (2.83%) |
229.96 |
229.58 - 237.11 |
2.3387 times |
Thu 20 November 2025 |
229.11 (-1.85%) |
237.24 |
228.90 - 239.10 |
2.2446 times |
Wed 19 November 2025 |
233.43 (-0.01%) |
233.80 |
232.43 - 236.37 |
1.3466 times |
Weekly price and charts Russell2000 Strong weekly Stock price targets for Russell2000 IWM are 248.47 and 256.01 | Weekly Target 1 | 242.33 | | Weekly Target 2 | 247.07 | | Weekly Target 3 | 249.86666666667 | | Weekly Target 4 | 254.61 | | Weekly Target 5 | 257.41 |
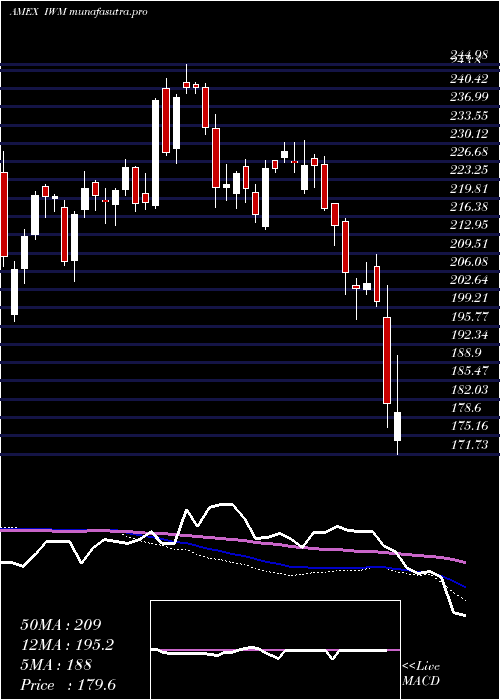
Weekly price and volumes for Russell 2000
| Date |
Closing |
Open |
Range |
Volume |
Thu 04 December 2025 |
251.82 (1.23%) |
245.57 |
245.12 - 252.66 |
0.8006 times |
Fri 28 November 2025 |
248.75 (5.58%) |
237.04 |
235.18 - 248.83 |
0.6691 times |
Fri 21 November 2025 |
235.60 (-0.79%) |
236.46 |
228.90 - 239.10 |
2.2759 times |
Fri 14 November 2025 |
237.48 (-1.71%) |
245.01 |
233.27 - 246.38 |
1.2323 times |
Fri 07 November 2025 |
241.61 (-1.88%) |
241.79 |
236.27 - 245.73 |
0.8792 times |
Fri 31 October 2025 |
246.23 (0%) |
244.99 |
243.69 - 246.79 |
0.2374 times |
Fri 31 October 2025 |
246.23 (-1.29%) |
251.78 |
243.69 - 252.21 |
1.2601 times |
Fri 24 October 2025 |
249.45 (2.48%) |
245.14 |
240.77 - 251.49 |
0.7968 times |
Fri 17 October 2025 |
243.41 (-0.31%) |
241.83 |
240.36 - 252.77 |
1.4986 times |
Tue 07 October 2025 |
244.16 (-0.68%) |
246.36 |
243.19 - 248.48 |
0.35 times |
Fri 03 October 2025 |
245.83 (1.86%) |
242.84 |
239.40 - 248.09 |
0.8784 times |
Monthly price and charts Russell2000 Strong monthly Stock price targets for Russell2000 IWM are 248.47 and 256.01 | Monthly Target 1 | 242.33 | | Monthly Target 2 | 247.07 | | Monthly Target 3 | 249.86666666667 | | Monthly Target 4 | 254.61 | | Monthly Target 5 | 257.41 |
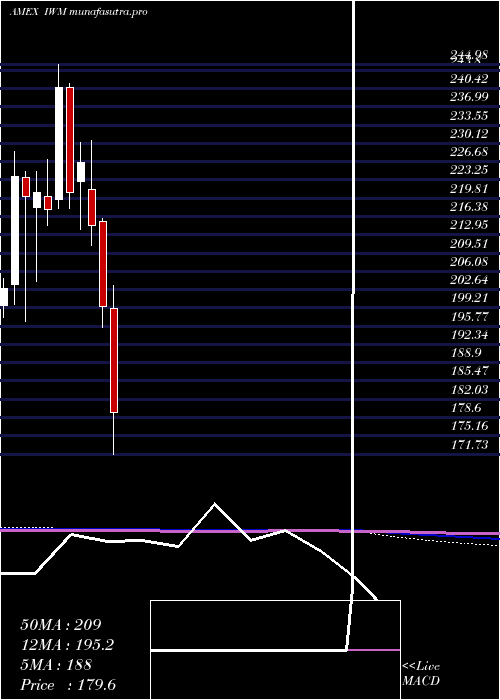
Monthly price and volumes Russell 2000
| Date |
Closing |
Open |
Range |
Volume |
Thu 04 December 2025 |
251.82 (1.23%) |
245.57 |
245.12 - 252.66 |
0.1842 times |
Fri 28 November 2025 |
248.75 (1.02%) |
241.79 |
228.90 - 248.83 |
1.1635 times |
Fri 31 October 2025 |
246.23 (1.76%) |
240.57 |
240.36 - 252.77 |
1.0676 times |
Tue 30 September 2025 |
241.96 (2.89%) |
231.99 |
231.47 - 247.18 |
1.2435 times |
Fri 29 August 2025 |
235.17 (7.19%) |
216.22 |
212.34 - 237.02 |
1.0327 times |
Thu 31 July 2025 |
219.39 (1.67%) |
214.62 |
214.15 - 226.71 |
1.1505 times |
Mon 30 June 2025 |
215.79 (5.23%) |
205.32 |
202.67 - 217.40 |
0.9545 times |
Fri 30 May 2025 |
205.07 (5.24%) |
195.71 |
193.74 - 210.13 |
0.8762 times |
Wed 30 April 2025 |
194.86 (-2.32%) |
198.99 |
171.73 - 203.33 |
1.3678 times |
Mon 31 March 2025 |
199.49 (-7.06%) |
215.40 |
195.49 - 215.96 |
0.9596 times |
Fri 28 February 2025 |
214.65 (-5.22%) |
221.51 |
210.96 - 230.70 |
0.6663 times |
DMA SMA EMA moving averages of Russell 2000 IWM
DMA (daily moving average) of Russell 2000 IWM
| DMA period | DMA value | | 5 day DMA | 248.2 | | 12 day DMA | 242.08 | | 20 day DMA | 241.29 | | 35 day DMA | 243.37 | | 50 day DMA | 243.56 | | 100 day DMA | 236.33 | | 150 day DMA | 227.16 | | 200 day DMA | 220.36 | EMA (exponential moving average) of Russell 2000 IWM
| EMA period | EMA current | EMA prev | EMA prev2 | | 5 day EMA | 248.22 | 246.42 | 244.81 | | 12 day EMA | 244.83 | 243.56 | 242.46 | | 20 day EMA | 243.58 | 242.71 | 241.98 | | 35 day EMA | 243.04 | 242.52 | 242.1 | | 50 day EMA | 243.82 | 243.49 | 243.24 |
SMA (simple moving average) of Russell 2000 IWM
| SMA period | SMA current | SMA prev | SMA prev2 | | 5 day SMA | 248.2 | 247.3 | 246.4 | | 12 day SMA | 242.08 | 240.49 | 239.48 | | 20 day SMA | 241.29 | 240.94 | 240.52 | | 35 day SMA | 243.37 | 243.33 | 243.28 | | 50 day SMA | 243.56 | 243.38 | 243.29 | | 100 day SMA | 236.33 | 236.06 | 235.8 | | 150 day SMA | 227.16 | 226.77 | 226.4 | | 200 day SMA | 220.36 | 220.23 | 220.1 |
|
|
