RussellTop IWL full analysis,charts,indicators,moving averages,SMA,DMA,EMA,ADX,MACD,RSIRussell Top IWL WideScreen charts, DMA,SMA,EMA technical analysis, forecast prediction, by indicators ADX,MACD,RSI,CCI AMEX stock exchange
Daily price and charts and targets RussellTop Strong Daily Stock price targets for RussellTop IWL are 167.23 and 168.27 | Daily Target 1 | 166.4 | | Daily Target 2 | 167.01 | | Daily Target 3 | 167.43666666667 | | Daily Target 4 | 168.05 | | Daily Target 5 | 168.48 |
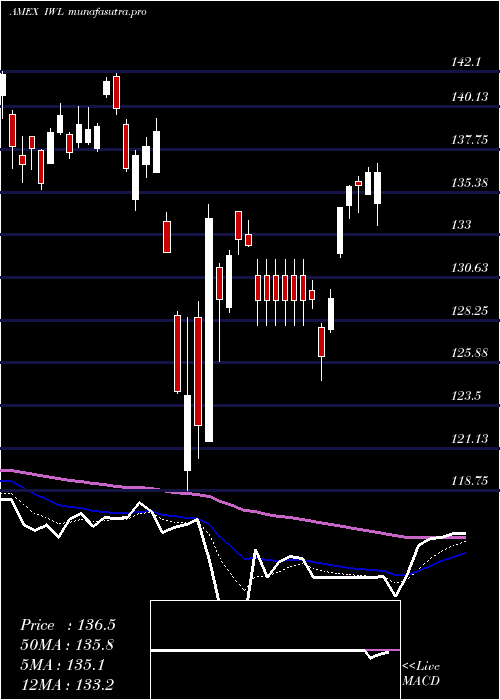
Daily price and volume Russell Top
| Date |
Closing |
Open |
Range |
Volume |
Thu 23 October 2025 |
167.63 (0.56%) |
166.82 |
166.82 - 167.86 |
0.4485 times |
Wed 22 October 2025 |
166.69 (-0.48%) |
167.69 |
165.58 - 167.69 |
1.4346 times |
Tue 21 October 2025 |
167.50 (-0.1%) |
167.73 |
167.37 - 167.96 |
0.5791 times |
Mon 20 October 2025 |
167.66 (1.03%) |
166.59 |
166.59 - 167.90 |
0.5424 times |
Fri 17 October 2025 |
165.95 (0.56%) |
165.07 |
164.40 - 166.25 |
0.5329 times |
Thu 16 October 2025 |
165.02 (-0.56%) |
166.44 |
164.13 - 166.63 |
1.2142 times |
Wed 15 October 2025 |
165.95 (0.42%) |
166.50 |
164.88 - 167.19 |
1.5353 times |
Tue 14 October 2025 |
165.26 (-0.26%) |
164.07 |
163.15 - 166.14 |
2.168 times |
Mon 13 October 2025 |
165.69 (-0.68%) |
165.09 |
164.87 - 165.95 |
0.6813 times |
Tue 07 October 2025 |
166.82 (-0.44%) |
167.77 |
166.52 - 167.82 |
0.8638 times |
Mon 06 October 2025 |
167.55 (0.51%) |
167.36 |
166.93 - 167.72 |
0.7205 times |
Weekly price and charts RussellTop Strong weekly Stock price targets for RussellTop IWL are 166.61 and 168.99 | Weekly Target 1 | 164.68 | | Weekly Target 2 | 166.15 | | Weekly Target 3 | 167.05666666667 | | Weekly Target 4 | 168.53 | | Weekly Target 5 | 169.44 |
Weekly price and volumes for Russell Top
| Date |
Closing |
Open |
Range |
Volume |
Thu 23 October 2025 |
167.63 (1.01%) |
166.59 |
165.58 - 167.96 |
0.6115 times |
Fri 17 October 2025 |
165.95 (-0.52%) |
165.09 |
163.15 - 167.19 |
1.2478 times |
Tue 07 October 2025 |
166.82 (0.07%) |
167.36 |
166.52 - 167.82 |
0.3224 times |
Fri 03 October 2025 |
166.70 (1.02%) |
165.53 |
164.98 - 167.58 |
1.0718 times |
Fri 26 September 2025 |
165.01 (-0.45%) |
165.37 |
163.25 - 166.66 |
1.5964 times |
Fri 19 September 2025 |
165.75 (1.36%) |
164.11 |
162.82 - 165.75 |
1.1309 times |
Fri 12 September 2025 |
163.53 (1.8%) |
161.09 |
160.88 - 163.89 |
1.3562 times |
Fri 05 September 2025 |
160.64 (0.41%) |
157.95 |
157.45 - 161.99 |
1.2998 times |
Fri 29 August 2025 |
159.99 (0%) |
160.70 |
159.54 - 160.70 |
0.2258 times |
Fri 29 August 2025 |
159.99 (0.06%) |
159.58 |
159.15 - 161.24 |
1.1374 times |
Fri 22 August 2025 |
159.90 (-0.04%) |
159.82 |
156.82 - 160.18 |
1.2844 times |

Monthly price and charts RussellTop Strong monthly Stock price targets for RussellTop IWL are 165.39 and 170.2 | Monthly Target 1 | 161.44 | | Monthly Target 2 | 164.53 | | Monthly Target 3 | 166.24666666667 | | Monthly Target 4 | 169.34 | | Monthly Target 5 | 171.06 |
Monthly price and volumes Russell Top
| Date |
Closing |
Open |
Range |
Volume |
Thu 23 October 2025 |
167.63 (0.92%) |
165.39 |
163.15 - 167.96 |
0.3917 times |
Tue 30 September 2025 |
166.10 (3.82%) |
157.95 |
157.45 - 166.66 |
0.8732 times |
Fri 29 August 2025 |
159.99 (2%) |
155.26 |
153.52 - 161.24 |
0.6819 times |
Thu 31 July 2025 |
156.86 (2.44%) |
152.71 |
152.27 - 159.03 |
0.5693 times |
Mon 30 June 2025 |
153.12 (5.12%) |
145.18 |
144.63 - 153.45 |
0.6972 times |
Fri 30 May 2025 |
145.66 (6.73%) |
138.30 |
136.92 - 146.73 |
0.8537 times |
Wed 30 April 2025 |
136.47 (-0.68%) |
136.91 |
118.75 - 139.44 |
2.0802 times |
Mon 31 March 2025 |
137.41 (-6.31%) |
147.14 |
134.32 - 147.51 |
1.8151 times |
Fri 28 February 2025 |
146.67 (-1.5%) |
146.36 |
143.78 - 151.73 |
0.9243 times |
Fri 31 January 2025 |
148.90 (2.9%) |
145.47 |
142.21 - 150.98 |
1.1135 times |
Tue 31 December 2024 |
144.71 (-1.68%) |
149.56 |
143.68 - 150.24 |
0.4617 times |

DMA SMA EMA moving averages of Russell Top IWL
DMA (daily moving average) of Russell Top IWL
| DMA period | DMA value | | 5 day DMA | 167.09 | | 12 day DMA | 166.54 | | 20 day DMA | 166.16 | | 35 day DMA | 164.72 | | 50 day DMA | 163.21 | | 100 day DMA | 157.83 | | 150 day DMA | 150.66 | | 200 day DMA | 149.54 | EMA (exponential moving average) of Russell Top IWL
| EMA period | EMA current | EMA prev | EMA prev2 | | 5 day EMA | 167.04 | 166.74 | 166.76 | | 12 day EMA | 166.54 | 166.34 | 166.28 | | 20 day EMA | 165.95 | 165.77 | 165.67 | | 35 day EMA | 164.55 | 164.37 | 164.23 | | 50 day EMA | 163.11 | 162.93 | 162.78 |
SMA (simple moving average) of Russell Top IWL
| SMA period | SMA current | SMA prev | SMA prev2 | | 5 day SMA | 167.09 | 166.56 | 166.42 | | 12 day SMA | 166.54 | 166.47 | 166.48 | | 20 day SMA | 166.16 | 166.11 | 166.06 | | 35 day SMA | 164.72 | 164.51 | 164.31 | | 50 day SMA | 163.21 | 163.02 | 162.86 | | 100 day SMA | 157.83 | 157.61 | 157.37 | | 150 day SMA | 150.66 | 150.46 | 150.28 | | 200 day SMA | 149.54 | 149.44 | 149.33 |
|
|
