Russell1000 IWF full analysis,charts,indicators,moving averages,SMA,DMA,EMA,ADX,MACD,RSIRussell 1000 IWF WideScreen charts, DMA,SMA,EMA technical analysis, forecast prediction, by indicators ADX,MACD,RSI,CCI AMEX stock exchange
Daily price and charts and targets Russell1000 Strong Daily Stock price targets for Russell1000 IWF are 476.49 and 478.96 | Daily Target 1 | 474.66 | | Daily Target 2 | 475.85 | | Daily Target 3 | 477.12666666667 | | Daily Target 4 | 478.32 | | Daily Target 5 | 479.6 |
Daily price and volume Russell 1000
| Date |
Closing |
Open |
Range |
Volume |
Fri 24 October 2025 |
477.05 (0.87%) |
476.30 |
475.93 - 478.40 |
0.4863 times |
Thu 23 October 2025 |
472.93 (0.85%) |
468.57 |
468.57 - 473.71 |
0.4874 times |
Wed 22 October 2025 |
468.95 (-0.76%) |
472.55 |
464.66 - 473.30 |
0.7827 times |
Tue 21 October 2025 |
472.55 (-0.02%) |
472.71 |
471.12 - 473.56 |
0.7555 times |
Mon 20 October 2025 |
472.64 (1.18%) |
469.75 |
469.66 - 473.55 |
1.8085 times |
Fri 17 October 2025 |
467.12 (0.51%) |
457.85 |
457.85 - 468.33 |
1.4911 times |
Thu 16 October 2025 |
464.77 (-0.48%) |
470.00 |
461.63 - 470.81 |
1.5191 times |
Wed 15 October 2025 |
467.03 (0.42%) |
469.68 |
462.77 - 471.41 |
0.9038 times |
Tue 14 October 2025 |
465.07 (-0.75%) |
463.48 |
459.03 - 468.29 |
1.1468 times |
Mon 13 October 2025 |
468.58 (1.98%) |
466.98 |
465.40 - 469.64 |
0.6187 times |
Fri 10 October 2025 |
459.47 (-3.19%) |
475.48 |
459.30 - 476.74 |
1.1243 times |
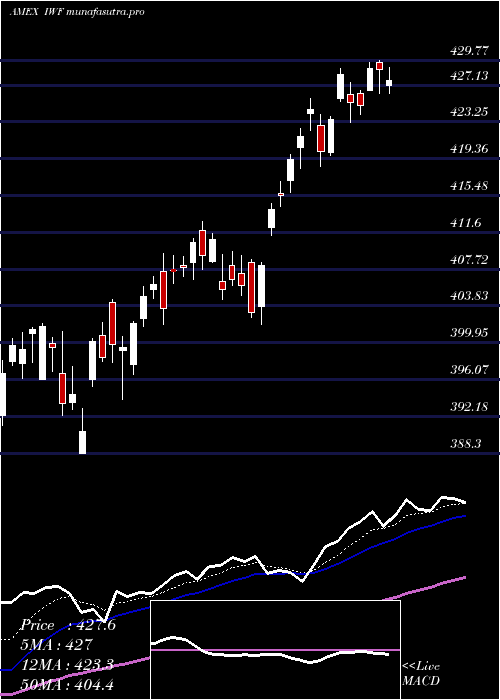
Weekly price and charts Russell1000 Strong weekly Stock price targets for Russell1000 IWF are 470.86 and 484.6 | Weekly Target 1 | 459.63 | | Weekly Target 2 | 468.34 | | Weekly Target 3 | 473.37 | | Weekly Target 4 | 482.08 | | Weekly Target 5 | 487.11 |
Weekly price and volumes for Russell 1000
| Date |
Closing |
Open |
Range |
Volume |
Fri 24 October 2025 |
477.05 (2.13%) |
469.75 |
464.66 - 478.40 |
0.9391 times |
Fri 17 October 2025 |
467.12 (1.66%) |
466.98 |
457.85 - 471.41 |
1.2345 times |
Fri 10 October 2025 |
459.47 (-2.23%) |
472.00 |
459.30 - 476.74 |
1.0492 times |
Fri 03 October 2025 |
469.94 (1.1%) |
466.71 |
464.43 - 473.82 |
1.4472 times |
Fri 26 September 2025 |
464.84 (-0.81%) |
467.90 |
459.21 - 473.01 |
1.42 times |
Fri 19 September 2025 |
468.65 (1.85%) |
462.35 |
457.22 - 469.00 |
1.2274 times |
Fri 12 September 2025 |
460.14 (2.41%) |
451.49 |
450.18 - 461.23 |
0.766 times |
Fri 05 September 2025 |
449.29 (0.83%) |
438.32 |
436.88 - 454.18 |
0.9048 times |
Fri 29 August 2025 |
445.59 (0%) |
449.44 |
444.20 - 449.58 |
0.1264 times |
Fri 29 August 2025 |
445.59 (0.07%) |
444.48 |
443.34 - 451.64 |
0.8853 times |
Fri 22 August 2025 |
445.26 (-0.84%) |
448.57 |
434.58 - 449.64 |
0.886 times |
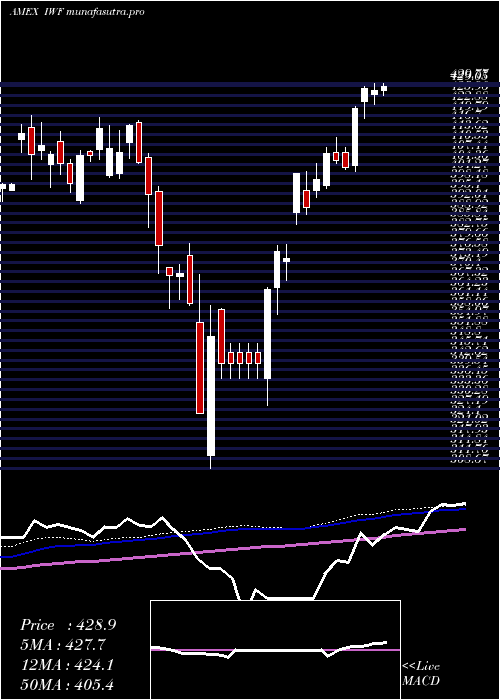
Monthly price and charts Russell1000 Strong monthly Stock price targets for Russell1000 IWF are 467.45 and 488 | Monthly Target 1 | 450.55 | | Monthly Target 2 | 463.8 | | Monthly Target 3 | 471.1 | | Monthly Target 4 | 484.35 | | Monthly Target 5 | 491.65 |
Monthly price and volumes Russell 1000
| Date |
Closing |
Open |
Range |
Volume |
Fri 24 October 2025 |
477.05 (1.84%) |
465.98 |
457.85 - 478.40 |
0.6343 times |
Tue 30 September 2025 |
468.41 (5.12%) |
438.32 |
436.88 - 473.01 |
0.8659 times |
Fri 29 August 2025 |
445.59 (1.18%) |
435.58 |
430.10 - 452.81 |
0.6353 times |
Thu 31 July 2025 |
440.41 (3.73%) |
422.90 |
418.54 - 448.79 |
0.8248 times |
Mon 30 June 2025 |
424.58 (6.3%) |
397.64 |
396.58 - 425.68 |
0.7192 times |
Fri 30 May 2025 |
399.43 (8.9%) |
373.59 |
367.58 - 404.53 |
1.0154 times |
Wed 30 April 2025 |
366.79 (1.58%) |
359.44 |
308.67 - 369.58 |
1.7093 times |
Mon 31 March 2025 |
361.09 (-8.49%) |
395.81 |
351.03 - 397.16 |
1.4088 times |
Fri 28 February 2025 |
394.60 (-3.59%) |
401.27 |
384.39 - 418.04 |
0.8127 times |
Fri 31 January 2025 |
409.31 (1.92%) |
403.21 |
391.80 - 419.00 |
1.3744 times |
Tue 31 December 2024 |
401.58 (0.91%) |
412.00 |
399.31 - 419.53 |
0.8245 times |
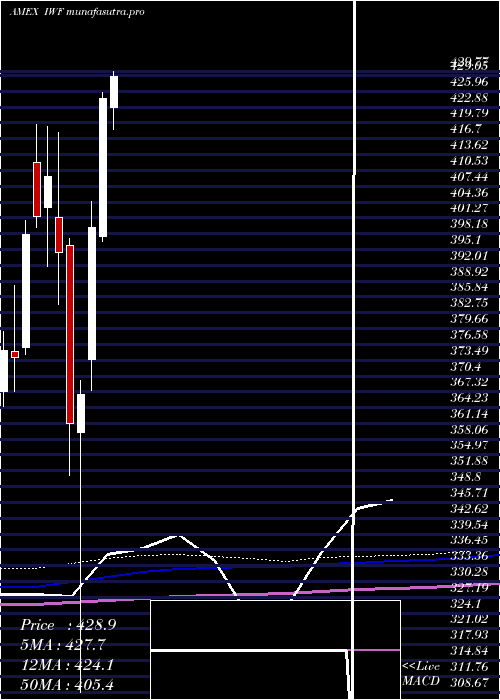
DMA SMA EMA moving averages of Russell 1000 IWF
DMA (daily moving average) of Russell 1000 IWF
| DMA period | DMA value | | 5 day DMA | 472.82 | | 12 day DMA | 469.23 | | 20 day DMA | 469.83 | | 35 day DMA | 466.64 | | 50 day DMA | 460.35 | | 100 day DMA | 443.57 | | 150 day DMA | 418.42 | | 200 day DMA | 412.99 | EMA (exponential moving average) of Russell 1000 IWF
| EMA period | EMA current | EMA prev | EMA prev2 | | 5 day EMA | 472.83 | 470.72 | 469.62 | | 12 day EMA | 470.63 | 469.46 | 468.83 | | 20 day EMA | 468.97 | 468.12 | 467.61 | | 35 day EMA | 464.74 | 464.02 | 463.5 | | 50 day EMA | 460.68 | 460.01 | 459.48 |
SMA (simple moving average) of Russell 1000 IWF
| SMA period | SMA current | SMA prev | SMA prev2 | | 5 day SMA | 472.82 | 470.84 | 469.21 | | 12 day SMA | 469.23 | 469.06 | 468.83 | | 20 day SMA | 469.83 | 469.22 | 468.72 | | 35 day SMA | 466.64 | 465.85 | 465.19 | | 50 day SMA | 460.35 | 459.79 | 459.34 | | 100 day SMA | 443.57 | 442.81 | 442.08 | | 150 day SMA | 418.42 | 417.71 | 417.01 | | 200 day SMA | 412.99 | 412.62 | 412.28 |
|
|
