Russell1000 IWB full analysis,charts,indicators,moving averages,SMA,DMA,EMA,ADX,MACD,RSIRussell 1000 IWB WideScreen charts, DMA,SMA,EMA technical analysis, forecast prediction, by indicators ADX,MACD,RSI,CCI AMEX stock exchange
Daily price and charts and targets Russell1000 Strong Daily Stock price targets for Russell1000 IWB are 367.58 and 370.36 | Daily Target 1 | 365.36 | | Daily Target 2 | 367.02 | | Daily Target 3 | 368.14333333333 | | Daily Target 4 | 369.8 | | Daily Target 5 | 370.92 |
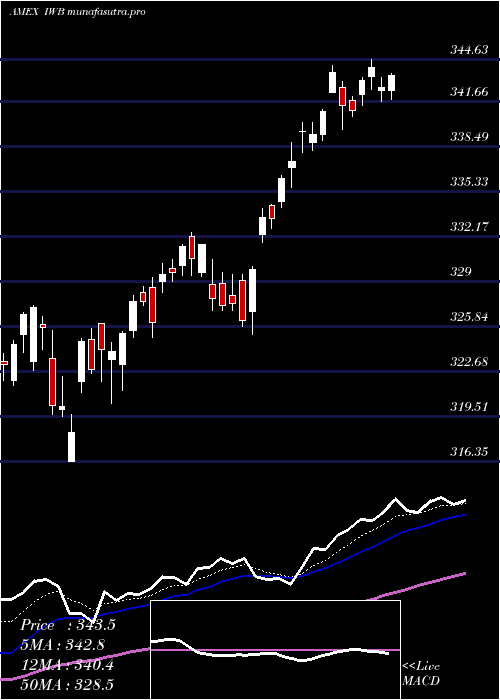
Daily price and volume Russell 1000
| Date |
Closing |
Open |
Range |
Volume |
Thu 23 October 2025 |
368.67 (0.64%) |
366.63 |
366.49 - 369.27 |
0.5452 times |
Wed 22 October 2025 |
366.32 (-0.62%) |
368.89 |
363.93 - 368.89 |
1.0264 times |
Tue 21 October 2025 |
368.61 (0.06%) |
368.56 |
367.68 - 369.50 |
1.7529 times |
Mon 20 October 2025 |
368.40 (1.05%) |
366.27 |
366.27 - 368.91 |
0.3658 times |
Fri 17 October 2025 |
364.57 (0.53%) |
361.81 |
361.08 - 365.23 |
1.3046 times |
Thu 16 October 2025 |
362.66 (-0.7%) |
366.35 |
360.83 - 367.08 |
1.4646 times |
Wed 15 October 2025 |
365.20 (0.42%) |
366.49 |
362.09 - 368.07 |
0.8987 times |
Tue 14 October 2025 |
363.66 (-0.1%) |
360.79 |
358.64 - 365.68 |
1.0877 times |
Mon 13 October 2025 |
364.04 (-0.87%) |
362.63 |
362.21 - 364.75 |
0.7524 times |
Tue 07 October 2025 |
367.23 (-0.44%) |
369.35 |
366.32 - 369.55 |
0.8017 times |
Mon 06 October 2025 |
368.84 (0.37%) |
368.88 |
367.62 - 369.35 |
0.6458 times |
Weekly price and charts Russell1000 Strong weekly Stock price targets for Russell1000 IWB are 366.3 and 371.87 | Weekly Target 1 | 361.8 | | Weekly Target 2 | 365.23 | | Weekly Target 3 | 367.36666666667 | | Weekly Target 4 | 370.8 | | Weekly Target 5 | 372.94 |
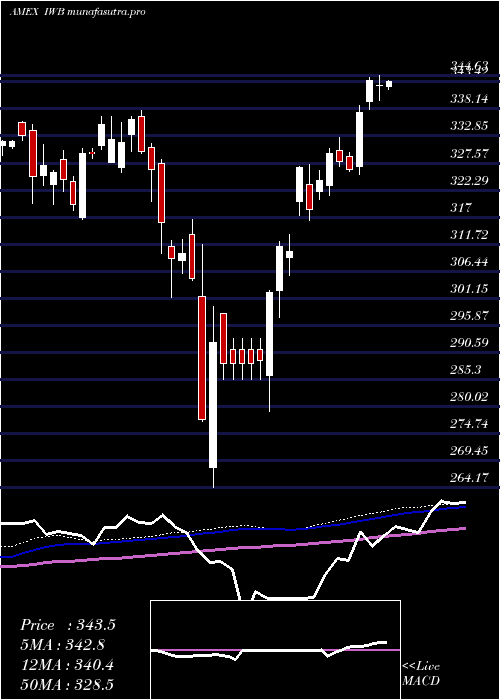
Weekly price and volumes for Russell 1000
| Date |
Closing |
Open |
Range |
Volume |
Thu 23 October 2025 |
368.67 (1.12%) |
366.27 |
363.93 - 369.50 |
0.5881 times |
Fri 17 October 2025 |
364.57 (-0.72%) |
362.63 |
358.64 - 368.07 |
0.8778 times |
Tue 07 October 2025 |
367.23 (-0.07%) |
368.88 |
366.32 - 369.55 |
0.2307 times |
Fri 03 October 2025 |
367.47 (1.07%) |
365.06 |
363.20 - 369.33 |
1.2886 times |
Fri 26 September 2025 |
363.59 (-0.34%) |
364.24 |
359.44 - 366.84 |
0.8921 times |
Fri 19 September 2025 |
364.84 (0.93%) |
362.81 |
358.71 - 365.44 |
1.5482 times |
Fri 12 September 2025 |
361.49 (1.53%) |
356.97 |
356.09 - 362.42 |
1.4843 times |
Fri 05 September 2025 |
356.04 (0.37%) |
350.32 |
349.22 - 358.74 |
0.8221 times |
Fri 29 August 2025 |
354.71 (0%) |
356.12 |
353.60 - 356.19 |
0.7295 times |
Fri 29 August 2025 |
354.71 (0.05%) |
354.00 |
352.69 - 357.09 |
1.5386 times |
Fri 22 August 2025 |
354.53 (0.36%) |
352.98 |
347.42 - 355.32 |
0.9596 times |
Monthly price and charts Russell1000 Strong monthly Stock price targets for Russell1000 IWB are 363.66 and 374.57 | Monthly Target 1 | 354.71 | | Monthly Target 2 | 361.69 | | Monthly Target 3 | 365.62 | | Monthly Target 4 | 372.6 | | Monthly Target 5 | 376.53 |
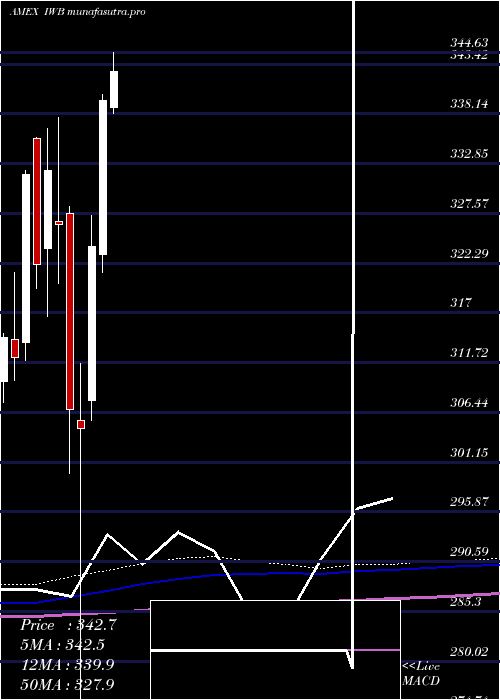
Monthly price and volumes Russell 1000
| Date |
Closing |
Open |
Range |
Volume |
Thu 23 October 2025 |
368.67 (0.87%) |
364.22 |
358.64 - 369.55 |
0.438 times |
Tue 30 September 2025 |
365.48 (3.04%) |
350.32 |
349.22 - 366.84 |
1.1501 times |
Fri 29 August 2025 |
354.71 (2.12%) |
343.76 |
340.11 - 357.09 |
1.0884 times |
Thu 31 July 2025 |
347.36 (2.29%) |
338.75 |
338.21 - 351.59 |
0.9579 times |
Mon 30 June 2025 |
339.57 (4.78%) |
323.23 |
321.31 - 340.19 |
0.9795 times |
Fri 30 May 2025 |
324.08 (6.37%) |
307.66 |
305.56 - 327.37 |
0.9105 times |
Wed 30 April 2025 |
304.67 (-0.67%) |
305.62 |
264.17 - 311.60 |
1.5851 times |
Mon 31 March 2025 |
306.74 (-6.02%) |
327.55 |
299.98 - 328.30 |
1.1301 times |
Fri 28 February 2025 |
326.39 (-1.74%) |
326.71 |
320.10 - 337.76 |
0.7767 times |
Fri 31 January 2025 |
332.16 (3.1%) |
323.87 |
316.63 - 336.61 |
0.9837 times |
Tue 31 December 2024 |
322.16 (-2.87%) |
335.53 |
319.57 - 335.66 |
1.3827 times |
DMA SMA EMA moving averages of Russell 1000 IWB
DMA (daily moving average) of Russell 1000 IWB
| DMA period | DMA value | | 5 day DMA | 367.31 | | 12 day DMA | 366.31 | | 20 day DMA | 365.63 | | 35 day DMA | 363.13 | | 50 day DMA | 360.23 | | 100 day DMA | 349.3 | | 150 day DMA | 334.32 | | 200 day DMA | 332.25 | EMA (exponential moving average) of Russell 1000 IWB
| EMA period | EMA current | EMA prev | EMA prev2 | | 5 day EMA | 367.28 | 366.59 | 366.72 | | 12 day EMA | 366.32 | 365.89 | 365.81 | | 20 day EMA | 365.25 | 364.89 | 364.74 | | 35 day EMA | 362.58 | 362.22 | 361.98 | | 50 day EMA | 359.93 | 359.57 | 359.29 |
SMA (simple moving average) of Russell 1000 IWB
| SMA period | SMA current | SMA prev | SMA prev2 | | 5 day SMA | 367.31 | 366.11 | 365.89 | | 12 day SMA | 366.31 | 366.2 | 366.25 | | 20 day SMA | 365.63 | 365.52 | 365.45 | | 35 day SMA | 363.13 | 362.74 | 362.4 | | 50 day SMA | 360.23 | 359.84 | 359.5 | | 100 day SMA | 349.3 | 348.86 | 348.38 | | 150 day SMA | 334.32 | 333.94 | 333.55 | | 200 day SMA | 332.25 | 332.04 | 331.81 |
|
|
