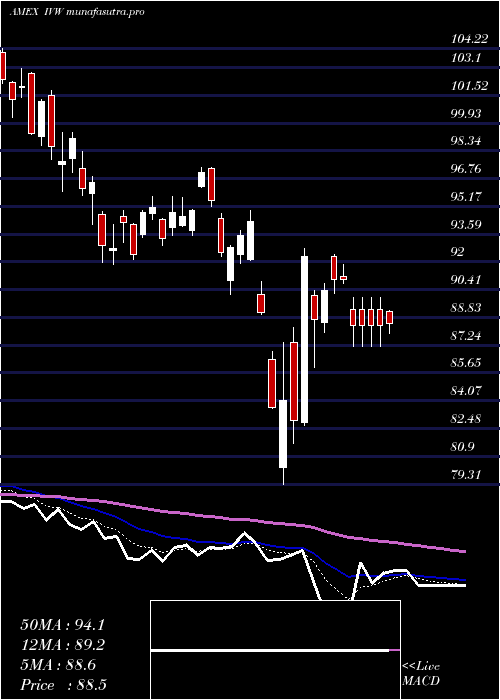
SP IVW full analysis,charts,indicators,moving averages,SMA,DMA,EMA,ADX,MACD,RSIS P IVW WideScreen charts, DMA,SMA,EMA technical analysis, forecast prediction, by indicators ADX,MACD,RSI,CCI AMEX stock exchange
Daily price and charts and targets SP Strong Daily Stock price targets for SP IVW are 120.91 and 122.16 | Daily Target 1 | 119.91 | | Daily Target 2 | 120.66 | | Daily Target 3 | 121.15666666667 | | Daily Target 4 | 121.91 | | Daily Target 5 | 122.41 |
Daily price and volume S P
| Date |
Closing |
Open |
Range |
Volume |
Thu 23 October 2025 |
121.42 (0.76%) |
120.41 |
120.40 - 121.65 |
0.5531 times |
Wed 22 October 2025 |
120.51 (-0.55%) |
121.46 |
119.46 - 121.59 |
0.8684 times |
Tue 21 October 2025 |
121.18 (-0.2%) |
121.43 |
120.94 - 121.53 |
0.8471 times |
Mon 20 October 2025 |
121.42 (0.85%) |
121.10 |
120.84 - 121.65 |
0.6093 times |
Fri 17 October 2025 |
120.40 (0.53%) |
119.25 |
118.89 - 120.60 |
1.0134 times |
Thu 16 October 2025 |
119.76 (-0.53%) |
120.85 |
118.98 - 121.36 |
1.5849 times |
Wed 15 October 2025 |
120.40 (0.48%) |
121.01 |
119.19 - 121.48 |
1.1035 times |
Tue 14 October 2025 |
119.82 (-0.75%) |
119.42 |
118.18 - 120.75 |
1.9209 times |
Mon 13 October 2025 |
120.73 (-0.21%) |
120.25 |
119.88 - 120.95 |
0.8973 times |
Tue 07 October 2025 |
120.98 (-0.54%) |
121.76 |
120.57 - 121.95 |
0.602 times |
Mon 06 October 2025 |
121.64 (0.48%) |
121.52 |
120.97 - 121.86 |
0.5853 times |
Weekly price and charts SP Strong weekly Stock price targets for SP IVW are 120.44 and 122.63 | Weekly Target 1 | 118.65 | | Weekly Target 2 | 120.04 | | Weekly Target 3 | 120.84333333333 | | Weekly Target 4 | 122.23 | | Weekly Target 5 | 123.03 |
Weekly price and volumes for S P
| Date |
Closing |
Open |
Range |
Volume |
Thu 23 October 2025 |
121.42 (0.85%) |
121.10 |
119.46 - 121.65 |
0.7483 times |
Fri 17 October 2025 |
120.40 (-0.48%) |
120.25 |
118.18 - 121.48 |
1.6953 times |
Tue 07 October 2025 |
120.98 (-0.07%) |
121.52 |
120.57 - 121.95 |
0.3087 times |
Fri 03 October 2025 |
121.06 (1.09%) |
120.38 |
119.69 - 122.98 |
0.9403 times |
Fri 26 September 2025 |
119.75 (-0.85%) |
120.54 |
118.27 - 121.77 |
1.3558 times |
Fri 19 September 2025 |
120.78 (1.5%) |
119.54 |
118.13 - 120.92 |
1.6407 times |
Fri 12 September 2025 |
119.00 (2.6%) |
116.50 |
116.24 - 119.29 |
1.1644 times |
Fri 05 September 2025 |
115.99 (0.95%) |
113.08 |
112.63 - 117.11 |
0.9721 times |
Fri 29 August 2025 |
114.90 (0%) |
115.82 |
114.46 - 115.82 |
0.1974 times |
Fri 29 August 2025 |
114.90 (-0.03%) |
114.76 |
114.46 - 116.39 |
0.977 times |
Fri 22 August 2025 |
114.93 (-0.45%) |
115.23 |
112.11 - 115.65 |
1.2928 times |

Monthly price and charts SP Strong monthly Stock price targets for SP IVW are 119.8 and 124.6 | Monthly Target 1 | 116.06 | | Monthly Target 2 | 118.74 | | Monthly Target 3 | 120.86 | | Monthly Target 4 | 123.54 | | Monthly Target 5 | 125.66 |
Monthly price and volumes S P
| Date |
Closing |
Open |
Range |
Volume |
Thu 23 October 2025 |
121.42 (0.58%) |
120.01 |
118.18 - 122.98 |
0.6146 times |
Tue 30 September 2025 |
120.72 (5.07%) |
113.08 |
112.63 - 121.77 |
1.0461 times |
Fri 29 August 2025 |
114.90 (0.88%) |
112.46 |
111.23 - 116.39 |
0.8765 times |
Thu 31 July 2025 |
113.90 (3.45%) |
109.65 |
108.48 - 115.69 |
0.9098 times |
Mon 30 June 2025 |
110.10 (6.29%) |
103.22 |
102.92 - 110.35 |
1.0741 times |
Fri 30 May 2025 |
103.58 (9.43%) |
96.30 |
95.32 - 104.86 |
1.2686 times |
Wed 30 April 2025 |
94.65 (1.96%) |
92.45 |
79.31 - 95.02 |
1.2803 times |
Mon 31 March 2025 |
92.83 (-8.24%) |
101.53 |
90.11 - 101.78 |
1.2419 times |
Fri 28 February 2025 |
101.17 (-2.9%) |
102.12 |
98.65 - 107.09 |
0.7282 times |
Fri 31 January 2025 |
104.19 (2.62%) |
102.11 |
99.50 - 107.14 |
0.96 times |
Tue 31 December 2024 |
101.53 (0.86%) |
103.83 |
100.67 - 105.64 |
0.6237 times |

DMA SMA EMA moving averages of S P IVW
DMA (daily moving average) of S P IVW
| DMA period | DMA value | | 5 day DMA | 120.99 | | 12 day DMA | 120.78 | | 20 day DMA | 120.6 | | 35 day DMA | 119.55 | | 50 day DMA | 118.21 | | 100 day DMA | 113.84 | | 150 day DMA | 107.4 | | 200 day DMA | 106.1 | EMA (exponential moving average) of S P IVW
| EMA period | EMA current | EMA prev | EMA prev2 | | 5 day EMA | 120.97 | 120.74 | 120.85 | | 12 day EMA | 120.73 | 120.61 | 120.63 | | 20 day EMA | 120.38 | 120.27 | 120.24 | | 35 day EMA | 119.27 | 119.14 | 119.06 | | 50 day EMA | 118.14 | 118.01 | 117.91 |
SMA (simple moving average) of S P IVW
| SMA period | SMA current | SMA prev | SMA prev2 | | 5 day SMA | 120.99 | 120.65 | 120.63 | | 12 day SMA | 120.78 | 120.78 | 120.84 | | 20 day SMA | 120.6 | 120.62 | 120.63 | | 35 day SMA | 119.55 | 119.37 | 119.21 | | 50 day SMA | 118.21 | 118.07 | 117.95 | | 100 day SMA | 113.84 | 113.66 | 113.47 | | 150 day SMA | 107.4 | 107.22 | 107.03 | | 200 day SMA | 106.1 | 106 | 105.91 |
|
|
