SP IVV full analysis,charts,indicators,moving averages,SMA,DMA,EMA,ADX,MACD,RSIS P IVV WideScreen charts, DMA,SMA,EMA technical analysis, forecast prediction, by indicators ADX,MACD,RSI,CCI AMEX stock exchange
Daily price and charts and targets SP Strong Daily Stock price targets for SP IVV are 672.2 and 678.69 | Daily Target 1 | 666.97 | | Daily Target 2 | 670.93 | | Daily Target 3 | 673.46333333333 | | Daily Target 4 | 677.42 | | Daily Target 5 | 679.95 |
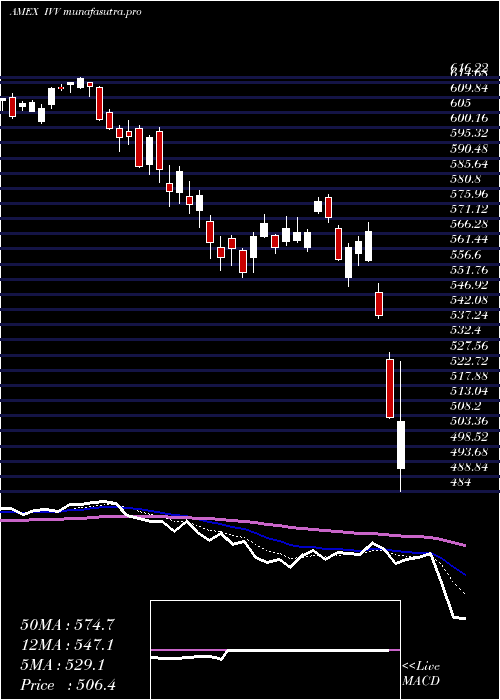
Daily price and volume S P
| Date |
Closing |
Open |
Range |
Volume |
Thu 23 October 2025 |
674.88 (0.56%) |
672.18 |
669.51 - 676.00 |
0.4536 times |
Wed 22 October 2025 |
671.11 (-0.49%) |
675.27 |
666.60 - 675.28 |
0.4715 times |
Tue 21 October 2025 |
674.43 (-0.02%) |
674.74 |
673.27 - 676.27 |
1.8282 times |
Mon 20 October 2025 |
674.58 (1.03%) |
670.31 |
668.51 - 675.50 |
0.6472 times |
Fri 17 October 2025 |
667.69 (0.56%) |
655.98 |
654.63 - 668.94 |
0.9105 times |
Thu 16 October 2025 |
663.98 (-0.64%) |
670.12 |
660.40 - 671.90 |
0.6896 times |
Wed 15 October 2025 |
668.28 (0.42%) |
670.08 |
662.17 - 673.47 |
1.2484 times |
Tue 14 October 2025 |
665.48 (-0.11%) |
660.41 |
656.36 - 669.06 |
1.1599 times |
Mon 13 October 2025 |
666.23 (1.53%) |
663.84 |
662.99 - 667.85 |
1.2085 times |
Fri 10 October 2025 |
656.20 (-2.72%) |
675.42 |
656.03 - 677.20 |
1.3825 times |
Thu 09 October 2025 |
674.52 (-0.28%) |
676.80 |
672.50 - 677.19 |
0.4525 times |
Weekly price and charts SP Strong weekly Stock price targets for SP IVV are 670.74 and 680.41 | Weekly Target 1 | 662.91 | | Weekly Target 2 | 668.9 | | Weekly Target 3 | 672.58333333333 | | Weekly Target 4 | 678.57 | | Weekly Target 5 | 682.25 |
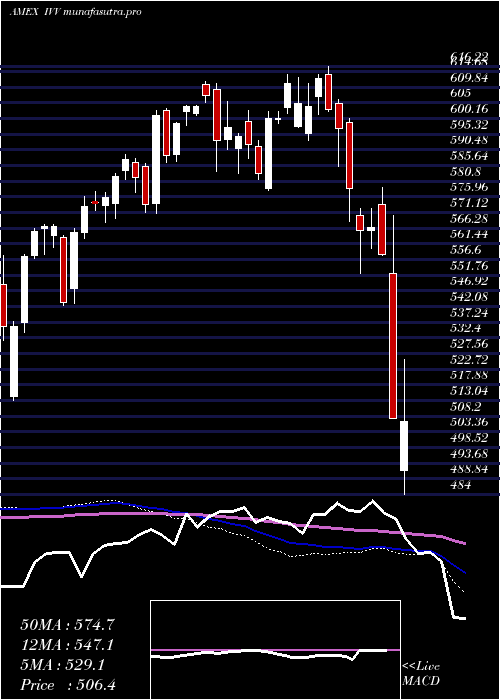
Weekly price and volumes for S P
| Date |
Closing |
Open |
Range |
Volume |
Thu 23 October 2025 |
674.88 (1.08%) |
670.31 |
666.60 - 676.27 |
0.6539 times |
Fri 17 October 2025 |
667.69 (1.75%) |
663.84 |
654.63 - 673.47 |
1.0032 times |
Fri 10 October 2025 |
656.20 (-2.41%) |
673.90 |
656.03 - 677.20 |
0.7759 times |
Fri 03 October 2025 |
672.42 (1.13%) |
667.57 |
664.85 - 675.93 |
0.8733 times |
Fri 26 September 2025 |
664.89 (-0.3%) |
665.39 |
657.57 - 670.55 |
1.5152 times |
Fri 19 September 2025 |
666.87 (0.93%) |
662.94 |
655.62 - 667.72 |
1.9606 times |
Fri 12 September 2025 |
660.72 (1.58%) |
651.84 |
650.45 - 662.46 |
1.802 times |
Fri 05 September 2025 |
650.47 (0.33%) |
640.64 |
638.05 - 655.44 |
0.6647 times |
Fri 29 August 2025 |
648.32 (0%) |
650.69 |
646.35 - 651.06 |
0.129 times |
Fri 29 August 2025 |
648.32 (-0.03%) |
647.23 |
644.75 - 652.69 |
0.6221 times |
Fri 22 August 2025 |
648.50 (0.28%) |
646.00 |
636.04 - 649.68 |
0.626 times |
Monthly price and charts SP Strong monthly Stock price targets for SP IVV are 664.76 and 687.33 | Monthly Target 1 | 646.33 | | Monthly Target 2 | 660.61 | | Monthly Target 3 | 668.90333333333 | | Monthly Target 4 | 683.18 | | Monthly Target 5 | 691.47 |
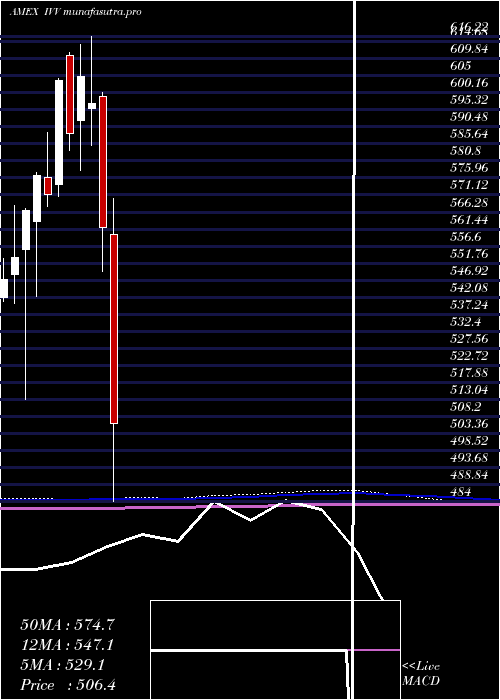
Monthly price and volumes S P
| Date |
Closing |
Open |
Range |
Volume |
Thu 23 October 2025 |
674.88 (0.83%) |
666.36 |
654.63 - 677.20 |
0.6729 times |
Tue 30 September 2025 |
669.30 (3.24%) |
640.64 |
638.05 - 670.55 |
1.4289 times |
Fri 29 August 2025 |
648.32 (2.11%) |
629.36 |
622.31 - 652.69 |
0.6286 times |
Thu 31 July 2025 |
634.90 (2.25%) |
619.31 |
618.48 - 642.94 |
0.8121 times |
Mon 30 June 2025 |
620.90 (4.86%) |
590.55 |
587.88 - 622.12 |
1.072 times |
Fri 30 May 2025 |
592.15 (6.13%) |
563.02 |
558.69 - 598.41 |
0.9542 times |
Wed 30 April 2025 |
557.96 (-0.7%) |
560.02 |
484.00 - 570.04 |
1.3734 times |
Mon 31 March 2025 |
561.90 (-5.89%) |
599.08 |
549.40 - 600.20 |
1.562 times |
Fri 28 February 2025 |
597.04 (-1.26%) |
595.58 |
585.30 - 616.22 |
0.6275 times |
Fri 31 January 2025 |
604.66 (2.71%) |
592.17 |
578.00 - 613.79 |
0.8684 times |
Tue 31 December 2024 |
588.68 (-2.5%) |
610.75 |
583.67 - 611.48 |
1.1235 times |
DMA SMA EMA moving averages of S P IVV
DMA (daily moving average) of S P IVV
| DMA period | DMA value | | 5 day DMA | 672.54 | | 12 day DMA | 669.48 | | 20 day DMA | 669.94 | | 35 day DMA | 666.02 | | 50 day DMA | 660.21 | | 100 day DMA | 641.11 | | 150 day DMA | 613.57 | | 200 day DMA | 608.56 | EMA (exponential moving average) of S P IVV
| EMA period | EMA current | EMA prev | EMA prev2 | | 5 day EMA | 672.33 | 671.05 | 671.02 | | 12 day EMA | 670.45 | 669.65 | 669.38 | | 20 day EMA | 668.79 | 668.15 | 667.84 | | 35 day EMA | 664.49 | 663.88 | 663.45 | | 50 day EMA | 660.14 | 659.54 | 659.07 |
SMA (simple moving average) of S P IVV
| SMA period | SMA current | SMA prev | SMA prev2 | | 5 day SMA | 672.54 | 670.36 | 669.79 | | 12 day SMA | 669.48 | 669.28 | 669.59 | | 20 day SMA | 669.94 | 669.26 | 668.92 | | 35 day SMA | 666.02 | 665.38 | 664.68 | | 50 day SMA | 660.21 | 659.67 | 659.21 | | 100 day SMA | 641.11 | 640.28 | 639.5 | | 150 day SMA | 613.57 | 612.85 | 612.16 | | 200 day SMA | 608.56 | 608.15 | 607.75 |
|
|
