SP IVOV full analysis,charts,indicators,moving averages,SMA,DMA,EMA,ADX,MACD,RSIS P IVOV WideScreen charts, DMA,SMA,EMA technical analysis, forecast prediction, by indicators ADX,MACD,RSI,CCI AMEX stock exchange
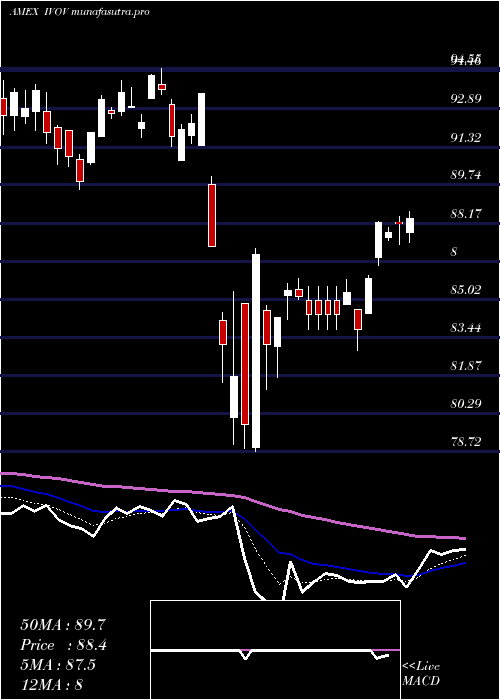
Daily price and charts and targets SP Strong Daily Stock price targets for SP IVOV are 100.62 and 101.81 | Daily Target 1 | 99.65 | | Daily Target 2 | 100.4 | | Daily Target 3 | 100.84333333333 | | Daily Target 4 | 101.59 | | Daily Target 5 | 102.03 |
Daily price and volume S P
| Date |
Closing |
Open |
Range |
Volume |
Thu 23 October 2025 |
101.14 (0.99%) |
100.37 |
100.10 - 101.29 |
0.6229 times |
Wed 22 October 2025 |
100.15 (-0.95%) |
100.89 |
99.82 - 100.97 |
0.752 times |
Tue 21 October 2025 |
101.11 (0.22%) |
100.87 |
100.87 - 101.40 |
1.1961 times |
Mon 20 October 2025 |
100.89 (1.37%) |
100.16 |
100.16 - 101.01 |
0.8659 times |
Fri 17 October 2025 |
99.53 (0.29%) |
99.11 |
98.89 - 99.67 |
2.3232 times |
Thu 16 October 2025 |
99.24 (-1.23%) |
100.87 |
98.89 - 100.87 |
0.8742 times |
Wed 15 October 2025 |
100.48 (-0.01%) |
101.33 |
100.06 - 101.33 |
0.9733 times |
Tue 14 October 2025 |
100.49 (1.25%) |
98.27 |
98.27 - 100.86 |
1.032 times |
Mon 13 October 2025 |
99.25 (1.86%) |
98.70 |
98.70 - 99.53 |
0.5981 times |
Fri 10 October 2025 |
97.44 (-2.91%) |
100.66 |
97.33 - 100.74 |
0.7622 times |
Thu 09 October 2025 |
100.36 (-1.07%) |
101.47 |
100.26 - 101.79 |
0.6919 times |
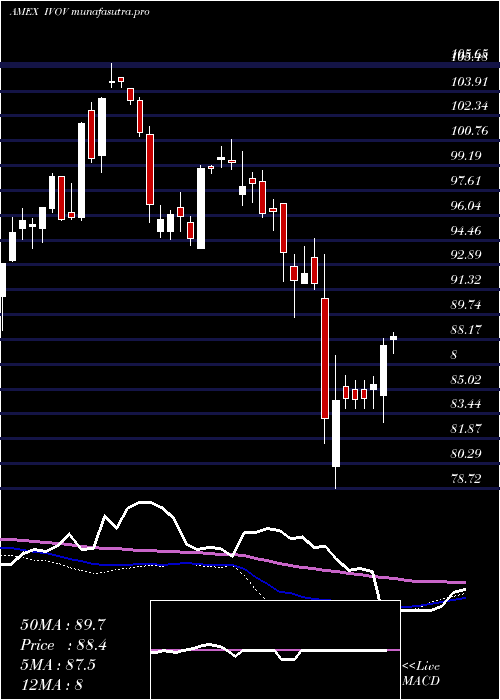
Weekly price and charts SP Strong weekly Stock price targets for SP IVOV are 100.48 and 102.06 | Weekly Target 1 | 99.21 | | Weekly Target 2 | 100.17 | | Weekly Target 3 | 100.78666666667 | | Weekly Target 4 | 101.75 | | Weekly Target 5 | 102.37 |
Weekly price and volumes for S P
| Date |
Closing |
Open |
Range |
Volume |
Thu 23 October 2025 |
101.14 (1.62%) |
100.16 |
99.82 - 101.40 |
0.5118 times |
Fri 17 October 2025 |
99.53 (2.14%) |
98.70 |
98.27 - 101.33 |
0.8637 times |
Fri 10 October 2025 |
97.44 (-4.25%) |
103.34 |
97.33 - 103.34 |
0.6886 times |
Fri 03 October 2025 |
101.76 (1.03%) |
101.29 |
99.74 - 102.27 |
3.1168 times |
Fri 26 September 2025 |
100.72 (-0.2%) |
100.59 |
99.54 - 101.74 |
0.7246 times |
Fri 19 September 2025 |
100.92 (-0.46%) |
101.72 |
100.32 - 102.11 |
1.3584 times |
Fri 12 September 2025 |
101.39 (-0.53%) |
101.06 |
100.55 - 102.36 |
0.997 times |
Fri 05 September 2025 |
101.93 (1.1%) |
99.81 |
99.60 - 102.26 |
0.7019 times |
Fri 29 August 2025 |
100.82 (0%) |
100.99 |
100.60 - 101.40 |
0.0838 times |
Fri 29 August 2025 |
100.82 (-0.3%) |
100.73 |
100.35 - 101.67 |
0.9533 times |
Fri 22 August 2025 |
101.12 (3.54%) |
97.60 |
97.40 - 101.25 |
18.8539 times |
Monthly price and charts SP Strong monthly Stock price targets for SP IVOV are 99.24 and 105.25 | Monthly Target 1 | 94.59 | | Monthly Target 2 | 97.87 | | Monthly Target 3 | 100.60333333333 | | Monthly Target 4 | 103.88 | | Monthly Target 5 | 106.61 |
Monthly price and volumes S P
| Date |
Closing |
Open |
Range |
Volume |
Thu 23 October 2025 |
101.14 (0.37%) |
100.29 |
97.33 - 103.34 |
0.2889 times |
Tue 30 September 2025 |
100.77 (-0.05%) |
99.81 |
99.54 - 102.36 |
0.7394 times |
Fri 29 August 2025 |
100.82 (4.69%) |
95.19 |
94.22 - 101.67 |
2.471 times |
Thu 31 July 2025 |
96.30 (0.87%) |
95.02 |
95.02 - 99.73 |
0.5507 times |
Mon 30 June 2025 |
95.47 (3.81%) |
91.96 |
90.54 - 96.11 |
0.8402 times |
Fri 30 May 2025 |
91.97 (4.69%) |
88.09 |
87.55 - 94.75 |
0.6843 times |
Wed 30 April 2025 |
87.85 (-4.55%) |
91.78 |
78.72 - 93.54 |
1.5587 times |
Mon 31 March 2025 |
92.04 (-4.41%) |
96.79 |
89.55 - 96.81 |
0.9151 times |
Fri 28 February 2025 |
96.29 (-3.08%) |
97.34 |
95.09 - 100.06 |
0.7328 times |
Fri 31 January 2025 |
99.35 (3.98%) |
96.07 |
93.93 - 100.82 |
1.2188 times |
Tue 31 December 2024 |
95.55 (-8.57%) |
104.08 |
94.47 - 104.08 |
0.6145 times |

DMA SMA EMA moving averages of S P IVOV
DMA (daily moving average) of S P IVOV
| DMA period | DMA value | | 5 day DMA | 100.56 | | 12 day DMA | 100.13 | | 20 day DMA | 100.51 | | 35 day DMA | 100.77 | | 50 day DMA | 100.5 | | 100 day DMA | 98.31 | | 150 day DMA | 95.29 | | 200 day DMA | 95.61 | EMA (exponential moving average) of S P IVOV
| EMA period | EMA current | EMA prev | EMA prev2 | | 5 day EMA | 100.61 | 100.34 | 100.44 | | 12 day EMA | 100.43 | 100.3 | 100.33 | | 20 day EMA | 100.43 | 100.36 | 100.38 | | 35 day EMA | 100.29 | 100.24 | 100.25 | | 50 day EMA | 100.24 | 100.2 | 100.2 |
SMA (simple moving average) of S P IVOV
| SMA period | SMA current | SMA prev | SMA prev2 | | 5 day SMA | 100.56 | 100.18 | 100.25 | | 12 day SMA | 100.13 | 100.1 | 100.24 | | 20 day SMA | 100.51 | 100.44 | 100.45 | | 35 day SMA | 100.77 | 100.78 | 100.77 | | 50 day SMA | 100.5 | 100.44 | 100.42 | | 100 day SMA | 98.31 | 98.21 | 98.14 | | 150 day SMA | 95.29 | 95.24 | 95.19 | | 200 day SMA | 95.61 | 95.58 | 95.56 |
|
|
