SP IVOG full analysis,charts,indicators,moving averages,SMA,DMA,EMA,ADX,MACD,RSIS P IVOG WideScreen charts, DMA,SMA,EMA technical analysis, forecast prediction, by indicators ADX,MACD,RSI,CCI AMEX stock exchange
Daily price and charts and targets SP Strong Daily Stock price targets for SP IVOG are 120.82 and 121.62 | Daily Target 1 | 120.69 | | Daily Target 2 | 120.95 | | Daily Target 3 | 121.48666666667 | | Daily Target 4 | 121.75 | | Daily Target 5 | 122.29 |
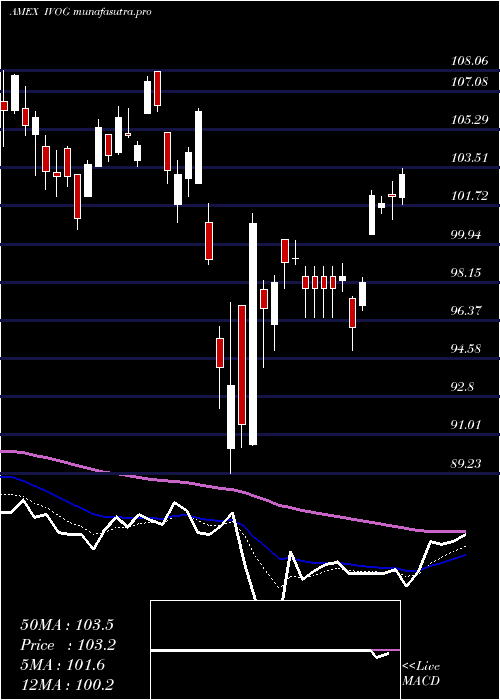
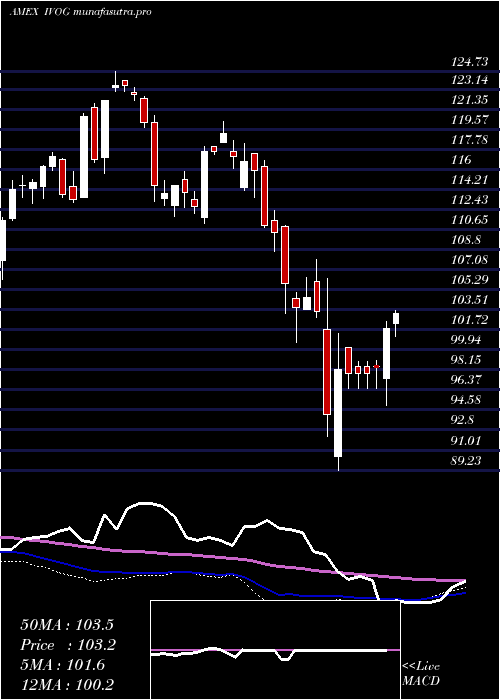
Daily price and volume S P
| Date |
Closing |
Open |
Range |
Volume |
Fri 24 October 2025 |
121.22 (0.79%) |
121.66 |
121.22 - 122.02 |
0.8004 times |
Thu 23 October 2025 |
120.27 (1.41%) |
118.65 |
118.65 - 120.60 |
0.4859 times |
Wed 22 October 2025 |
118.60 (-1.26%) |
119.67 |
117.78 - 120.20 |
1.0143 times |
Tue 21 October 2025 |
120.11 (0.7%) |
118.92 |
118.79 - 120.17 |
0.8668 times |
Mon 20 October 2025 |
119.28 (1.08%) |
119.04 |
118.65 - 119.50 |
1.3457 times |
Fri 17 October 2025 |
118.00 (0.23%) |
117.56 |
117.06 - 118.27 |
1.7109 times |
Thu 16 October 2025 |
117.73 (-1.14%) |
119.65 |
117.40 - 119.65 |
0.618 times |
Wed 15 October 2025 |
119.09 (-0.05%) |
120.37 |
118.45 - 120.37 |
0.9195 times |
Tue 14 October 2025 |
119.15 (0.57%) |
117.25 |
117.25 - 119.91 |
1.3642 times |
Mon 13 October 2025 |
118.48 (-0.5%) |
117.43 |
117.23 - 118.75 |
0.8743 times |
Tue 07 October 2025 |
119.07 (-1.24%) |
120.52 |
118.56 - 120.68 |
0.5879 times |
Weekly price and charts SP Strong weekly Stock price targets for SP IVOG are 119.5 and 123.74 | Weekly Target 1 | 116.1 | | Weekly Target 2 | 118.66 | | Weekly Target 3 | 120.34 | | Weekly Target 4 | 122.9 | | Weekly Target 5 | 124.58 |
Weekly price and volumes for S P
| Date |
Closing |
Open |
Range |
Volume |
Fri 24 October 2025 |
121.22 (2.73%) |
119.04 |
117.78 - 122.02 |
0.3293 times |
Fri 17 October 2025 |
118.00 (-0.9%) |
117.43 |
117.06 - 120.37 |
0.4004 times |
Tue 07 October 2025 |
119.07 (-0.98%) |
121.00 |
118.56 - 121.17 |
0.0926 times |
Fri 03 October 2025 |
120.25 (0.48%) |
120.35 |
118.58 - 120.98 |
0.3837 times |
Fri 26 September 2025 |
119.67 (-0.69%) |
120.04 |
117.86 - 121.52 |
0.3344 times |
Fri 19 September 2025 |
120.50 (0.31%) |
120.24 |
119.10 - 121.47 |
0.3569 times |
Fri 12 September 2025 |
120.13 (-0.08%) |
120.72 |
118.63 - 121.31 |
0.4817 times |
Fri 05 September 2025 |
120.23 (1.67%) |
117.06 |
116.90 - 121.29 |
7.2322 times |
Fri 29 August 2025 |
118.26 (0%) |
119.30 |
117.82 - 119.30 |
0.0412 times |
Fri 29 August 2025 |
118.26 (-0.04%) |
117.89 |
117.41 - 119.33 |
0.3476 times |
Fri 22 August 2025 |
118.31 (2.04%) |
115.95 |
114.82 - 119.00 |
0.2942 times |
Monthly price and charts SP Strong monthly Stock price targets for SP IVOG are 119.14 and 124.1 | Monthly Target 1 | 115.14 | | Monthly Target 2 | 118.18 | | Monthly Target 3 | 120.1 | | Monthly Target 4 | 123.14 | | Monthly Target 5 | 125.06 |
Monthly price and volumes S P
| Date |
Closing |
Open |
Range |
Volume |
Fri 24 October 2025 |
121.22 (1.46%) |
118.77 |
117.06 - 122.02 |
0.3315 times |
Tue 30 September 2025 |
119.48 (1.03%) |
117.06 |
116.90 - 121.52 |
2.5757 times |
Fri 29 August 2025 |
118.26 (2.31%) |
114.27 |
112.70 - 119.33 |
0.6363 times |
Thu 31 July 2025 |
115.59 (2.26%) |
112.76 |
112.50 - 118.46 |
0.5636 times |
Mon 30 June 2025 |
113.03 (2.93%) |
109.27 |
108.17 - 113.65 |
0.5342 times |
Fri 30 May 2025 |
109.81 (6.7%) |
103.60 |
103.42 - 112.62 |
0.5614 times |
Wed 30 April 2025 |
102.91 (-0.25%) |
102.99 |
89.23 - 106.26 |
1.7898 times |
Mon 31 March 2025 |
103.17 (-6.51%) |
110.92 |
100.61 - 110.98 |
1.2136 times |
Fri 28 February 2025 |
110.35 (-5.8%) |
114.34 |
108.68 - 118.29 |
0.9124 times |
Fri 31 January 2025 |
117.14 (3.95%) |
113.70 |
111.17 - 120.28 |
0.8816 times |
Tue 31 December 2024 |
112.69 (-8.72%) |
122.87 |
111.77 - 123.25 |
0.8617 times |

DMA SMA EMA moving averages of S P IVOG
DMA (daily moving average) of S P IVOG
| DMA period | DMA value | | 5 day DMA | 119.9 | | 12 day DMA | 119.3 | | 20 day DMA | 119.39 | | 35 day DMA | 119.64 | | 50 day DMA | 118.96 | | 100 day DMA | 116.23 | | 150 day DMA | 112.07 | | 200 day DMA | 112.33 | EMA (exponential moving average) of S P IVOG
| EMA period | EMA current | EMA prev | EMA prev2 | | 5 day EMA | 120.02 | 119.42 | 119 | | 12 day EMA | 119.6 | 119.3 | 119.12 | | 20 day EMA | 119.46 | 119.28 | 119.18 | | 35 day EMA | 119.03 | 118.9 | 118.82 | | 50 day EMA | 118.74 | 118.64 | 118.57 |
SMA (simple moving average) of S P IVOG
| SMA period | SMA current | SMA prev | SMA prev2 | | 5 day SMA | 119.9 | 119.25 | 118.74 | | 12 day SMA | 119.3 | 119.22 | 119.2 | | 20 day SMA | 119.39 | 119.35 | 119.36 | | 35 day SMA | 119.64 | 119.54 | 119.49 | | 50 day SMA | 118.96 | 118.87 | 118.75 | | 100 day SMA | 116.23 | 116.11 | 116.02 | | 150 day SMA | 112.07 | 111.97 | 111.86 | | 200 day SMA | 112.33 | 112.3 | 112.26 |
|
|
