WedbushEtfmg IVES full analysis,charts,indicators,moving averages,SMA,DMA,EMA,ADX,MACD,RSIWedbush Etfmg IVES WideScreen charts, DMA,SMA,EMA technical analysis, forecast prediction, by indicators ADX,MACD,RSI,CCI AMEX stock exchange
Daily price and charts and targets WedbushEtfmg Strong Daily Stock price targets for WedbushEtfmg IVES are 32.92 and 33.82 | Daily Target 1 | 32.18 | | Daily Target 2 | 32.76 | | Daily Target 3 | 33.08 | | Daily Target 4 | 33.66 | | Daily Target 5 | 33.98 |
Daily price and volume Wedbush Etfmg
| Date |
Closing |
Open |
Range |
Volume |
Thu 23 October 2025 |
33.34 (1.86%) |
32.69 |
32.50 - 33.40 |
0.8414 times |
Wed 22 October 2025 |
32.73 (-1.53%) |
33.27 |
32.18 - 33.65 |
0.8701 times |
Tue 21 October 2025 |
33.24 (-0.89%) |
33.49 |
33.14 - 33.49 |
0.6648 times |
Mon 20 October 2025 |
33.54 (1.12%) |
33.20 |
33.20 - 33.76 |
0.6222 times |
Fri 17 October 2025 |
33.17 (-0.54%) |
32.23 |
32.10 - 33.37 |
0.8999 times |
Thu 16 October 2025 |
33.35 (-0.48%) |
33.78 |
33.00 - 33.98 |
0.7171 times |
Wed 15 October 2025 |
33.51 (1.27%) |
33.72 |
33.00 - 33.90 |
1.2155 times |
Tue 14 October 2025 |
33.09 (-1.52%) |
33.08 |
32.52 - 33.61 |
0.9102 times |
Mon 13 October 2025 |
33.60 (3.77%) |
33.34 |
33.16 - 33.66 |
1.1126 times |
Fri 10 October 2025 |
32.38 (-4.2%) |
33.84 |
32.36 - 33.99 |
2.1462 times |
Thu 09 October 2025 |
33.80 (0%) |
33.77 |
33.45 - 33.80 |
1.023 times |
Weekly price and charts WedbushEtfmg Strong weekly Stock price targets for WedbushEtfmg IVES are 32.76 and 34.34 | Weekly Target 1 | 31.51 | | Weekly Target 2 | 32.43 | | Weekly Target 3 | 33.093333333333 | | Weekly Target 4 | 34.01 | | Weekly Target 5 | 34.67 |
Weekly price and volumes for Wedbush Etfmg
| Date |
Closing |
Open |
Range |
Volume |
Thu 23 October 2025 |
33.34 (0.51%) |
33.20 |
32.18 - 33.76 |
0.7323 times |
Fri 17 October 2025 |
33.17 (2.44%) |
33.34 |
32.10 - 33.98 |
1.1858 times |
Fri 10 October 2025 |
32.38 (-1.04%) |
33.01 |
32.36 - 33.99 |
1.6911 times |
Fri 03 October 2025 |
32.72 (2.93%) |
32.12 |
31.79 - 33.76 |
1.1483 times |
Fri 26 September 2025 |
31.79 (-1.21%) |
32.12 |
31.24 - 32.69 |
1.3667 times |
Fri 19 September 2025 |
32.18 (4.86%) |
31.03 |
30.88 - 32.21 |
1.3078 times |
Fri 12 September 2025 |
30.69 (6.23%) |
29.15 |
29.15 - 30.75 |
1.1899 times |
Fri 05 September 2025 |
28.89 (1.94%) |
27.73 |
27.62 - 28.98 |
0.5504 times |
Fri 29 August 2025 |
28.34 (0%) |
28.69 |
28.19 - 28.69 |
0.1344 times |
Fri 29 August 2025 |
28.34 (2.05%) |
27.75 |
27.55 - 28.71 |
0.6932 times |
Fri 22 August 2025 |
27.77 (-1.73%) |
28.23 |
26.75 - 28.31 |
1.0225 times |
Monthly price and charts WedbushEtfmg Strong monthly Stock price targets for WedbushEtfmg IVES are 32.6 and 34.73 | Monthly Target 1 | 30.93 | | Monthly Target 2 | 32.14 | | Monthly Target 3 | 33.063333333333 | | Monthly Target 4 | 34.27 | | Monthly Target 5 | 35.19 |
Monthly price and volumes Wedbush Etfmg
| Date |
Closing |
Open |
Range |
Volume |
Thu 23 October 2025 |
33.34 (3.8%) |
31.97 |
31.86 - 33.99 |
2.062 times |
Tue 30 September 2025 |
32.12 (13.34%) |
27.73 |
27.62 - 32.69 |
2.2799 times |
Fri 29 August 2025 |
28.34 (0.82%) |
27.49 |
26.75 - 28.71 |
1.5532 times |
Thu 31 July 2025 |
28.11 (3.69%) |
26.95 |
26.37 - 28.74 |
1.739 times |
Mon 30 June 2025 |
27.11 (-45%) |
25.37 |
25.07 - 27.19 |
2.3338 times |
Fri 18 October 2024 |
49.29 (2.69%) |
47.37 |
44.90 - 50.00 |
0.0018 times |
Mon 30 September 2024 |
48.00 (3.76%) |
45.99 |
44.39 - 48.24 |
0.0039 times |
Fri 30 August 2024 |
46.26 (0.11%) |
44.74 |
42.34 - 47.52 |
0.0018 times |
Wed 31 July 2024 |
46.21 (1.78%) |
45.42 |
44.42 - 47.24 |
0.0203 times |
Fri 28 June 2024 |
45.40 (3.44%) |
44.34 |
43.69 - 45.77 |
0.0043 times |
Fri 31 May 2024 |
43.89 (-0.2%) |
43.58 |
43.58 - 46.95 |
0.0022 times |
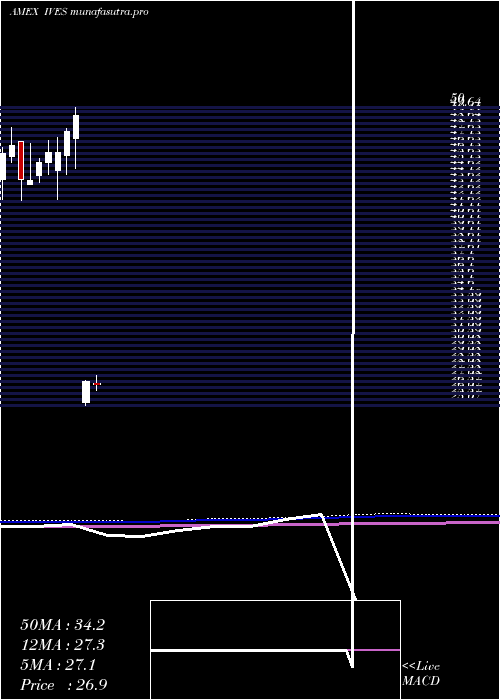
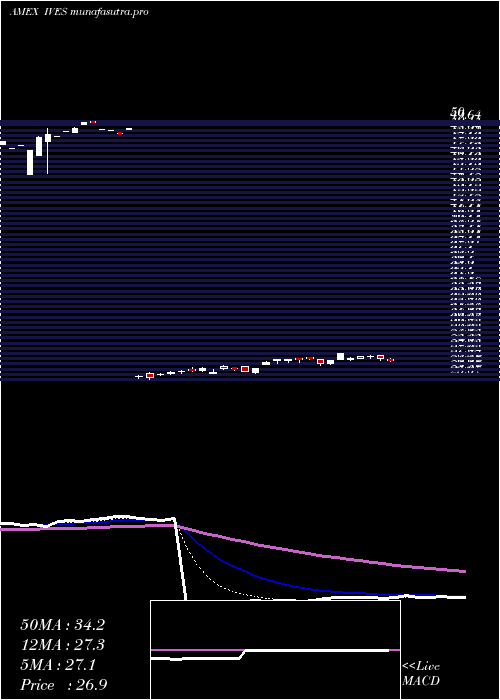
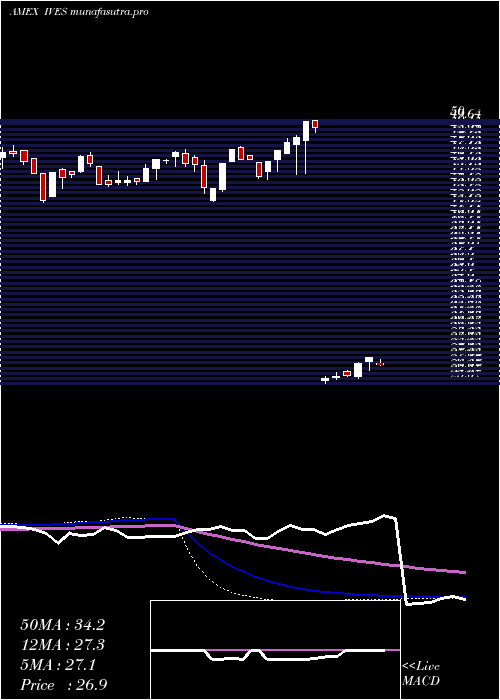
DMA SMA EMA moving averages of Wedbush Etfmg IVES
DMA (daily moving average) of Wedbush Etfmg IVES
| DMA period | DMA value | | 5 day DMA | 33.2 | | 12 day DMA | 33.3 | | 20 day DMA | 33.02 | | 35 day DMA | 32.19 | | 50 day DMA | 30.94 | | 100 day DMA | 29.47 | | 150 day DMA | 35.23 | | 200 day DMA | 37.69 | EMA (exponential moving average) of Wedbush Etfmg IVES
| EMA period | EMA current | EMA prev | EMA prev2 | | 5 day EMA | 33.19 | 33.12 | 33.32 | | 12 day EMA | 33.13 | 33.09 | 33.16 | | 20 day EMA | 32.83 | 32.78 | 32.78 | | 35 day EMA | 31.91 | 31.83 | 31.78 | | 50 day EMA | 30.95 | 30.85 | 30.77 |
SMA (simple moving average) of Wedbush Etfmg IVES
| SMA period | SMA current | SMA prev | SMA prev2 | | 5 day SMA | 33.2 | 33.21 | 33.36 | | 12 day SMA | 33.3 | 33.27 | 33.33 | | 20 day SMA | 33.02 | 32.94 | 32.92 | | 35 day SMA | 32.19 | 32.05 | 31.92 | | 50 day SMA | 30.94 | 30.83 | 30.75 | | 100 day SMA | 29.47 | 29.63 | 29.8 | | 150 day SMA | 35.23 | 35.29 | 35.36 | | 200 day SMA | 37.69 | 37.75 | 37.81 |
|
|
