IntegraResources ITRG full analysis,charts,indicators,moving averages,SMA,DMA,EMA,ADX,MACD,RSIIntegra Resources ITRG WideScreen charts, DMA,SMA,EMA technical analysis, forecast prediction, by indicators ADX,MACD,RSI,CCI AMEX stock exchange
Daily price and charts and targets IntegraResources Strong Daily Stock price targets for IntegraResources ITRG are 2.75 and 2.95 | Daily Target 1 | 2.71 | | Daily Target 2 | 2.79 | | Daily Target 3 | 2.9066666666667 | | Daily Target 4 | 2.99 | | Daily Target 5 | 3.11 |
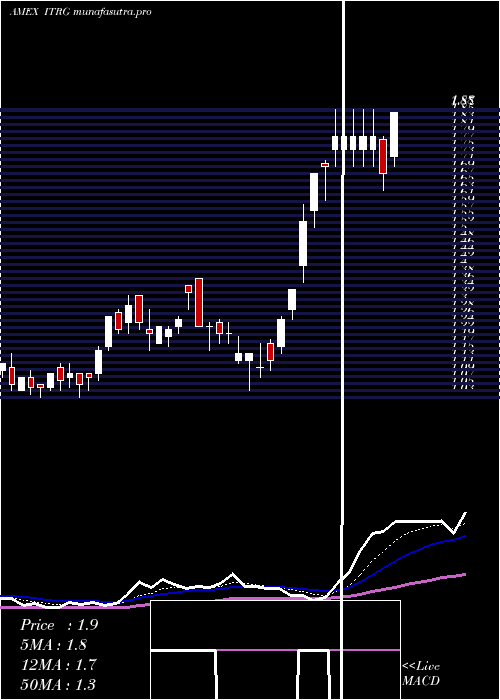
Daily price and volume Integra Resources
| Date |
Closing |
Open |
Range |
Volume |
Fri 24 October 2025 |
2.88 (-3.36%) |
2.89 |
2.82 - 3.02 |
0.9345 times |
Thu 23 October 2025 |
2.98 (4.93%) |
2.78 |
2.78 - 3.11 |
0.6847 times |
Wed 22 October 2025 |
2.84 (1.43%) |
2.67 |
2.62 - 2.85 |
0.7893 times |
Tue 21 October 2025 |
2.80 (-10.54%) |
3.00 |
2.75 - 3.04 |
1.2466 times |
Mon 20 October 2025 |
3.13 (2.62%) |
3.05 |
3.02 - 3.17 |
0.6181 times |
Fri 17 October 2025 |
3.05 (-6.44%) |
3.01 |
2.92 - 3.11 |
1.304 times |
Thu 16 October 2025 |
3.26 (-4.12%) |
3.47 |
3.21 - 3.49 |
1.2937 times |
Wed 15 October 2025 |
3.40 (8.97%) |
3.17 |
3.17 - 3.41 |
1.3637 times |
Tue 14 October 2025 |
3.12 (-2.5%) |
3.16 |
3.01 - 3.22 |
0.9166 times |
Mon 13 October 2025 |
3.20 (-0.62%) |
3.23 |
3.19 - 3.34 |
0.8488 times |
Tue 07 October 2025 |
3.22 (-1.23%) |
3.33 |
3.16 - 3.33 |
0.7063 times |
Weekly price and charts IntegraResources Strong weekly Stock price targets for IntegraResources ITRG are 2.48 and 3.03 | Weekly Target 1 | 2.34 | | Weekly Target 2 | 2.61 | | Weekly Target 3 | 2.89 | | Weekly Target 4 | 3.16 | | Weekly Target 5 | 3.44 |
Weekly price and volumes for Integra Resources
| Date |
Closing |
Open |
Range |
Volume |
Fri 24 October 2025 |
2.88 (-5.57%) |
3.05 |
2.62 - 3.17 |
1.0279 times |
Fri 17 October 2025 |
3.05 (-5.28%) |
3.23 |
2.92 - 3.49 |
1.3776 times |
Tue 07 October 2025 |
3.22 (2.22%) |
3.31 |
3.16 - 3.35 |
0.3619 times |
Fri 03 October 2025 |
3.15 (6.78%) |
3.07 |
2.85 - 3.31 |
1.1252 times |
Fri 26 September 2025 |
2.95 (0.68%) |
3.03 |
2.68 - 3.10 |
1.2936 times |
Fri 19 September 2025 |
2.93 (9.33%) |
2.74 |
2.52 - 2.93 |
1.2478 times |
Fri 12 September 2025 |
2.68 (4.69%) |
2.58 |
2.54 - 2.75 |
1.0096 times |
Fri 05 September 2025 |
2.56 (11.79%) |
2.41 |
2.34 - 2.57 |
1.2948 times |
Fri 29 August 2025 |
2.29 (0%) |
2.17 |
2.15 - 2.29 |
0.1694 times |
Fri 29 August 2025 |
2.29 (16.24%) |
1.98 |
1.98 - 2.29 |
1.0922 times |
Fri 22 August 2025 |
1.97 (10.06%) |
1.83 |
1.80 - 1.97 |
0.808 times |

Monthly price and charts IntegraResources Strong monthly Stock price targets for IntegraResources ITRG are 2.32 and 3.19 | Monthly Target 1 | 2.13 | | Monthly Target 2 | 2.5 | | Monthly Target 3 | 2.9966666666667 | | Monthly Target 4 | 3.37 | | Monthly Target 5 | 3.87 |
Monthly price and volumes Integra Resources
| Date |
Closing |
Open |
Range |
Volume |
Fri 24 October 2025 |
2.88 (-2.37%) |
3.05 |
2.62 - 3.49 |
1.4055 times |
Tue 30 September 2025 |
2.95 (28.82%) |
2.41 |
2.34 - 3.10 |
2.1132 times |
Fri 29 August 2025 |
2.29 (59.03%) |
1.49 |
1.44 - 2.29 |
1.339 times |
Thu 31 July 2025 |
1.44 (-4%) |
1.54 |
1.42 - 1.62 |
0.867 times |
Mon 30 June 2025 |
1.50 (-7.41%) |
1.65 |
1.41 - 1.90 |
1.1169 times |
Fri 30 May 2025 |
1.62 (-4.14%) |
1.70 |
1.43 - 1.95 |
1.0385 times |
Wed 30 April 2025 |
1.69 (36.29%) |
1.25 |
1.05 - 1.88 |
1.0236 times |
Mon 31 March 2025 |
1.24 (13.76%) |
1.09 |
1.03 - 1.38 |
0.3853 times |
Fri 28 February 2025 |
1.09 (3.81%) |
1.05 |
1.03 - 1.27 |
0.3201 times |
Fri 31 January 2025 |
1.05 (20.69%) |
0.88 |
0.79 - 1.07 |
0.3908 times |
Tue 31 December 2024 |
0.87 (-4.4%) |
0.97 |
0.85 - 1.01 |
0.162 times |

DMA SMA EMA moving averages of Integra Resources ITRG
DMA (daily moving average) of Integra Resources ITRG
| DMA period | DMA value | | 5 day DMA | 2.93 | | 12 day DMA | 3.1 | | 20 day DMA | 3.05 | | 35 day DMA | 2.9 | | 50 day DMA | 2.63 | | 100 day DMA | 2.1 | | 150 day DMA | 1.92 | | 200 day DMA | 1.7 | EMA (exponential moving average) of Integra Resources ITRG
| EMA period | EMA current | EMA prev | EMA prev2 | | 5 day EMA | 2.94 | 2.97 | 2.97 | | 12 day EMA | 3.01 | 3.03 | 3.04 | | 20 day EMA | 2.97 | 2.98 | 2.98 | | 35 day EMA | 2.8 | 2.79 | 2.78 | | 50 day EMA | 2.57 | 2.56 | 2.54 |
SMA (simple moving average) of Integra Resources ITRG
| SMA period | SMA current | SMA prev | SMA prev2 | | 5 day SMA | 2.93 | 2.96 | 3.02 | | 12 day SMA | 3.1 | 3.12 | 3.13 | | 20 day SMA | 3.05 | 3.06 | 3.06 | | 35 day SMA | 2.9 | 2.89 | 2.87 | | 50 day SMA | 2.63 | 2.61 | 2.58 | | 100 day SMA | 2.1 | 2.09 | 2.08 | | 150 day SMA | 1.92 | 1.91 | 1.9 | | 200 day SMA | 1.7 | 1.69 | 1.68 |
|
|
