ItTech ITP full analysis,charts,indicators,moving averages,SMA,DMA,EMA,ADX,MACD,RSIIt Tech ITP WideScreen charts, DMA,SMA,EMA technical analysis, forecast prediction, by indicators ADX,MACD,RSI,CCI AMEX stock exchange
Daily price and charts and targets ItTech Strong Daily Stock price targets for ItTech ITP are 0.23 and 0.26 | Daily Target 1 | 0.22 | | Daily Target 2 | 0.24 | | Daily Target 3 | 0.25333333333333 | | Daily Target 4 | 0.27 | | Daily Target 5 | 0.28 |
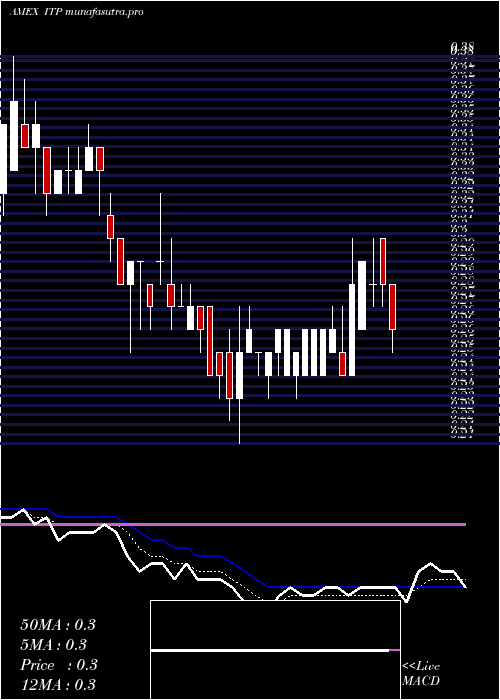
Daily price and volume It Tech
| Date |
Closing |
Open |
Range |
Volume |
Fri 24 October 2025 |
0.25 (0%) |
0.26 |
0.24 - 0.27 |
0.0413 times |
Thu 23 October 2025 |
0.25 (0%) |
0.27 |
0.24 - 0.28 |
0.0323 times |
Wed 22 October 2025 |
0.25 (-3.85%) |
0.23 |
0.23 - 0.26 |
0.0903 times |
Tue 21 October 2025 |
0.26 (0%) |
0.26 |
0.24 - 0.26 |
0.0629 times |
Mon 20 October 2025 |
0.26 (0%) |
0.26 |
0.25 - 0.27 |
0.0442 times |
Fri 17 October 2025 |
0.26 (-3.7%) |
0.25 |
0.25 - 0.27 |
0.0692 times |
Thu 16 October 2025 |
0.27 (-12.9%) |
0.30 |
0.25 - 0.31 |
0.274 times |
Wed 15 October 2025 |
0.31 (-8.82%) |
0.30 |
0.29 - 0.39 |
0.5993 times |
Tue 14 October 2025 |
0.34 (30.77%) |
0.34 |
0.28 - 0.39 |
6.4434 times |
Mon 13 October 2025 |
0.26 (0%) |
0.23 |
0.22 - 0.28 |
2.3432 times |
Tue 07 October 2025 |
0.26 (0%) |
0.26 |
0.25 - 0.27 |
0.0304 times |
Weekly price and charts ItTech Strong weekly Stock price targets for ItTech ITP are 0.22 and 0.27 | Weekly Target 1 | 0.2 | | Weekly Target 2 | 0.23 | | Weekly Target 3 | 0.25333333333333 | | Weekly Target 4 | 0.28 | | Weekly Target 5 | 0.3 |
Weekly price and volumes for It Tech
| Date |
Closing |
Open |
Range |
Volume |
Fri 24 October 2025 |
0.25 (-3.85%) |
0.26 |
0.23 - 0.28 |
0.1026 times |
Fri 17 October 2025 |
0.26 (0%) |
0.23 |
0.22 - 0.39 |
3.6848 times |
Tue 07 October 2025 |
0.26 (-3.7%) |
0.27 |
0.24 - 0.27 |
0.053 times |
Fri 03 October 2025 |
0.27 (-3.57%) |
0.27 |
0.23 - 0.32 |
0.2447 times |
Fri 26 September 2025 |
0.28 (16.67%) |
0.24 |
0.22 - 0.33 |
0.4905 times |
Fri 19 September 2025 |
0.24 (9.09%) |
0.22 |
0.21 - 0.25 |
0.2355 times |
Fri 12 September 2025 |
0.22 (4.76%) |
0.21 |
0.20 - 0.35 |
5.0753 times |
Fri 05 September 2025 |
0.21 (5%) |
0.19 |
0.19 - 0.21 |
0.024 times |
Fri 29 August 2025 |
0.20 (0%) |
0.20 |
0.19 - 0.21 |
0.0082 times |
Fri 29 August 2025 |
0.20 (0%) |
0.20 |
0.19 - 0.22 |
0.0815 times |
Fri 22 August 2025 |
0.20 (0%) |
0.20 |
0.18 - 0.22 |
0.0557 times |

Monthly price and charts ItTech Strong monthly Stock price targets for ItTech ITP are 0.15 and 0.32 | Monthly Target 1 | 0.12 | | Monthly Target 2 | 0.18 | | Monthly Target 3 | 0.28666666666667 | | Monthly Target 4 | 0.35 | | Monthly Target 5 | 0.46 |
Monthly price and volumes It Tech
| Date |
Closing |
Open |
Range |
Volume |
Fri 24 October 2025 |
0.25 (-13.79%) |
0.29 |
0.22 - 0.39 |
1.7273 times |
Tue 30 September 2025 |
0.29 (45%) |
0.19 |
0.19 - 0.35 |
2.585 times |
Fri 29 August 2025 |
0.20 (0%) |
0.19 |
0.18 - 0.22 |
0.0997 times |
Thu 31 July 2025 |
0.20 (5.26%) |
0.19 |
0.18 - 0.23 |
1.1208 times |
Mon 30 June 2025 |
0.19 (0%) |
0.19 |
0.17 - 0.23 |
0.2691 times |
Fri 30 May 2025 |
0.19 (-29.63%) |
0.25 |
0.15 - 1.00 |
3.7637 times |
Wed 30 April 2025 |
0.27 (0%) |
0.27 |
0.21 - 0.30 |
0.0172 times |
Mon 31 March 2025 |
0.27 (-30.77%) |
0.41 |
0.25 - 0.43 |
0.1145 times |
Fri 28 February 2025 |
0.39 (11.43%) |
0.31 |
0.30 - 0.45 |
0.1219 times |
Fri 31 January 2025 |
0.35 (-41.67%) |
0.46 |
0.34 - 0.71 |
0.1808 times |
Tue 31 December 2024 |
0.60 (172.73%) |
0.24 |
0.20 - 1.07 |
1.8079 times |

DMA SMA EMA moving averages of It Tech ITP
DMA (daily moving average) of It Tech ITP
| DMA period | DMA value | | 5 day DMA | 0.25 | | 12 day DMA | 0.27 | | 20 day DMA | 0.27 | | 35 day DMA | 0.26 | | 50 day DMA | 0.24 | | 100 day DMA | 0.22 | | 150 day DMA | 0.23 | | 200 day DMA | 0.27 | EMA (exponential moving average) of It Tech ITP
| EMA period | EMA current | EMA prev | EMA prev2 | | 5 day EMA | 0.26 | 0.26 | 0.26 | | 12 day EMA | 0.28 | 0.28 | 0.28 | | 20 day EMA | 0.26 | 0.26 | 0.26 | | 35 day EMA | 0.24 | 0.24 | 0.24 | | 50 day EMA | 0.23 | 0.23 | 0.23 |
SMA (simple moving average) of It Tech ITP
| SMA period | SMA current | SMA prev | SMA prev2 | | 5 day SMA | 0.25 | 0.26 | 0.26 | | 12 day SMA | 0.27 | 0.27 | 0.27 | | 20 day SMA | 0.27 | 0.28 | 0.28 | | 35 day SMA | 0.26 | 0.25 | 0.25 | | 50 day SMA | 0.24 | 0.24 | 0.24 | | 100 day SMA | 0.22 | 0.22 | 0.22 | | 150 day SMA | 0.23 | 0.23 | 0.23 | | 200 day SMA | 0.27 | 0.27 | 0.27 |
|
|
