BluestarIsrael ITEQ full analysis,charts,indicators,moving averages,SMA,DMA,EMA,ADX,MACD,RSIBluestar Israel ITEQ WideScreen charts, DMA,SMA,EMA technical analysis, forecast prediction, by indicators ADX,MACD,RSI,CCI AMEX stock exchange
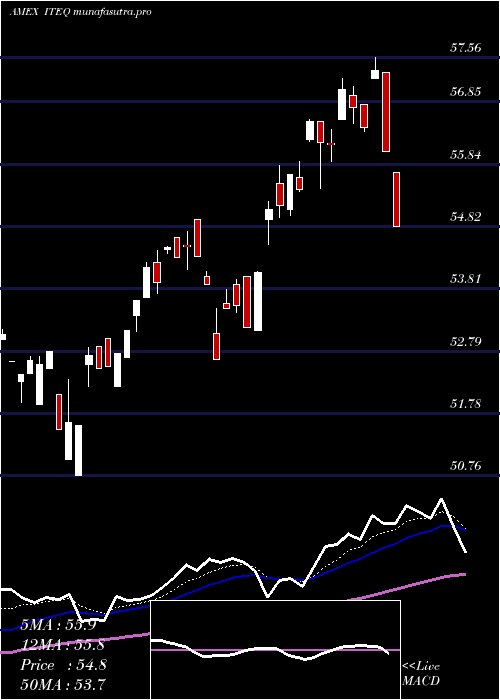
Daily price and charts and targets BluestarIsrael Strong Daily Stock price targets for BluestarIsrael ITEQ are 58.43 and 58.86 | Daily Target 1 | 58.07 | | Daily Target 2 | 58.35 | | Daily Target 3 | 58.503333333333 | | Daily Target 4 | 58.78 | | Daily Target 5 | 58.93 |
Daily price and volume Bluestar Israel
| Date |
Closing |
Open |
Range |
Volume |
Thu 23 October 2025 |
58.62 (1.35%) |
58.23 |
58.23 - 58.66 |
0.3205 times |
Wed 22 October 2025 |
57.84 (-1.2%) |
58.55 |
57.56 - 58.55 |
0.4834 times |
Tue 21 October 2025 |
58.54 (0.27%) |
58.39 |
58.18 - 58.87 |
2.1057 times |
Mon 20 October 2025 |
58.38 (1.65%) |
57.73 |
57.73 - 58.44 |
0.511 times |
Fri 17 October 2025 |
57.43 (-0.38%) |
57.29 |
57.23 - 57.61 |
0.3853 times |
Thu 16 October 2025 |
57.65 (-1%) |
58.75 |
57.50 - 58.88 |
1.0234 times |
Wed 15 October 2025 |
58.23 (-0.65%) |
59.10 |
58.19 - 59.10 |
0.6728 times |
Tue 14 October 2025 |
58.61 (0.5%) |
57.67 |
57.40 - 58.90 |
1.1463 times |
Mon 13 October 2025 |
58.32 (1.48%) |
58.34 |
57.93 - 58.49 |
2.629 times |
Fri 10 October 2025 |
57.47 (-2.97%) |
59.48 |
57.47 - 59.48 |
0.7227 times |
Thu 09 October 2025 |
59.23 (-0.07%) |
59.76 |
59.13 - 59.77 |
1.6821 times |
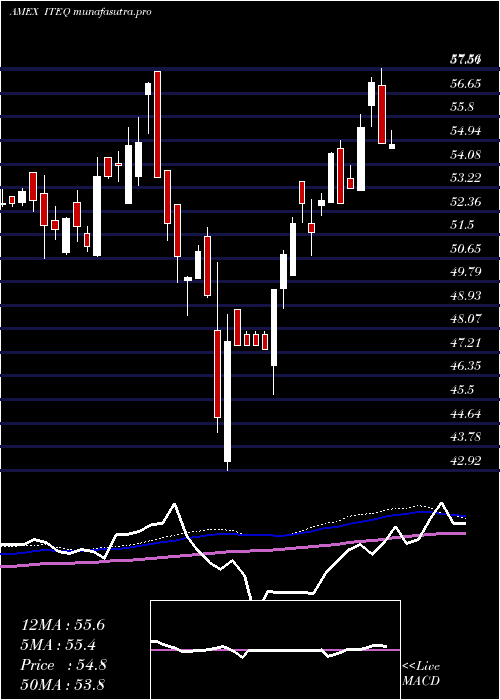
Weekly price and charts BluestarIsrael Strong weekly Stock price targets for BluestarIsrael ITEQ are 58.09 and 59.4 | Weekly Target 1 | 57.04 | | Weekly Target 2 | 57.83 | | Weekly Target 3 | 58.35 | | Weekly Target 4 | 59.14 | | Weekly Target 5 | 59.66 |
Weekly price and volumes for Bluestar Israel
| Date |
Closing |
Open |
Range |
Volume |
Thu 23 October 2025 |
58.62 (2.07%) |
57.73 |
57.56 - 58.87 |
0.8203 times |
Fri 17 October 2025 |
57.43 (-0.07%) |
58.34 |
57.23 - 59.10 |
1.4045 times |
Fri 10 October 2025 |
57.47 (-1.73%) |
59.36 |
57.47 - 59.77 |
0.9467 times |
Fri 03 October 2025 |
58.48 (0.07%) |
59.08 |
58.10 - 59.75 |
3.6164 times |
Fri 26 September 2025 |
58.44 (-1.3%) |
58.89 |
57.86 - 59.80 |
0.6992 times |
Fri 19 September 2025 |
59.21 (3.26%) |
57.30 |
57.12 - 59.35 |
1.0249 times |
Fri 12 September 2025 |
57.34 (2.5%) |
56.40 |
56.40 - 57.47 |
0.4034 times |
Fri 05 September 2025 |
55.94 (0.5%) |
54.39 |
54.03 - 57.95 |
0.756 times |
Fri 29 August 2025 |
55.66 (0%) |
55.79 |
55.51 - 55.79 |
0.0627 times |
Fri 29 August 2025 |
55.66 (2.32%) |
54.35 |
54.03 - 55.88 |
0.2659 times |
Fri 22 August 2025 |
54.40 (2.54%) |
53.22 |
52.61 - 54.47 |
0.747 times |
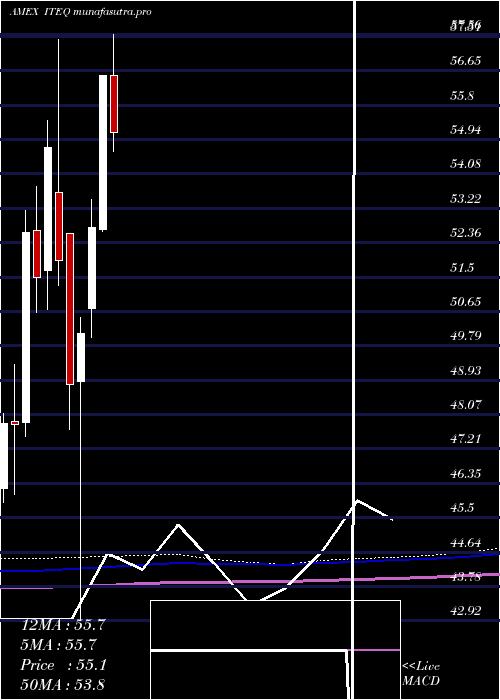
Monthly price and charts BluestarIsrael Strong monthly Stock price targets for BluestarIsrael ITEQ are 56.66 and 59.2 | Monthly Target 1 | 56 | | Monthly Target 2 | 57.31 | | Monthly Target 3 | 58.54 | | Monthly Target 4 | 59.85 | | Monthly Target 5 | 61.08 |
Monthly price and volumes Bluestar Israel
| Date |
Closing |
Open |
Range |
Volume |
Thu 23 October 2025 |
58.62 (-0.03%) |
58.66 |
57.23 - 59.77 |
0.7394 times |
Tue 30 September 2025 |
58.64 (5.35%) |
54.39 |
54.03 - 59.80 |
1.3549 times |
Fri 29 August 2025 |
55.66 (2.77%) |
53.68 |
51.14 - 55.88 |
1.034 times |
Thu 31 July 2025 |
54.16 (-4.19%) |
56.53 |
54.14 - 57.56 |
0.8789 times |
Mon 30 June 2025 |
56.53 (7.17%) |
52.69 |
52.65 - 56.55 |
1.0715 times |
Fri 30 May 2025 |
52.75 (5.33%) |
50.73 |
50.00 - 53.45 |
0.4277 times |
Wed 30 April 2025 |
50.08 (2.56%) |
48.90 |
42.92 - 50.49 |
0.6002 times |
Mon 31 March 2025 |
48.83 (-5.93%) |
52.59 |
47.71 - 52.59 |
0.6795 times |
Fri 28 February 2025 |
51.91 (-5.19%) |
53.62 |
51.30 - 57.44 |
0.5183 times |
Fri 31 January 2025 |
54.75 (6.35%) |
51.68 |
50.70 - 55.42 |
2.6957 times |
Tue 31 December 2024 |
51.48 (-2.19%) |
52.66 |
50.62 - 53.76 |
5.6438 times |
DMA SMA EMA moving averages of Bluestar Israel ITEQ
DMA (daily moving average) of Bluestar Israel ITEQ
| DMA period | DMA value | | 5 day DMA | 58.16 | | 12 day DMA | 58.3 | | 20 day DMA | 58.45 | | 35 day DMA | 58.19 | | 50 day DMA | 57.05 | | 100 day DMA | 55.89 | | 150 day DMA | 53.86 | | 200 day DMA | 53.67 | EMA (exponential moving average) of Bluestar Israel ITEQ
| EMA period | EMA current | EMA prev | EMA prev2 | | 5 day EMA | 58.27 | 58.1 | 58.23 | | 12 day EMA | 58.28 | 58.22 | 58.29 | | 20 day EMA | 58.19 | 58.14 | 58.17 | | 35 day EMA | 57.49 | 57.42 | 57.39 | | 50 day EMA | 56.77 | 56.69 | 56.64 |
SMA (simple moving average) of Bluestar Israel ITEQ
| SMA period | SMA current | SMA prev | SMA prev2 | | 5 day SMA | 58.16 | 57.97 | 58.05 | | 12 day SMA | 58.3 | 58.28 | 58.42 | | 20 day SMA | 58.45 | 58.43 | 58.47 | | 35 day SMA | 58.19 | 58.1 | 58 | | 50 day SMA | 57.05 | 56.92 | 56.83 | | 100 day SMA | 55.89 | 55.83 | 55.78 | | 150 day SMA | 53.86 | 53.81 | 53.76 | | 200 day SMA | 53.67 | 53.64 | 53.61 |
|
|
