IqCandriam IQSU full analysis,charts,indicators,moving averages,SMA,DMA,EMA,ADX,MACD,RSIIq Candriam IQSU WideScreen charts, DMA,SMA,EMA technical analysis, forecast prediction, by indicators ADX,MACD,RSI,CCI AMEX stock exchange
Daily price and charts and targets IqCandriam Strong Daily Stock price targets for IqCandriam IQSU are 53.81 and 54.06 | Daily Target 1 | 53.6 | | Daily Target 2 | 53.76 | | Daily Target 3 | 53.846666666667 | | Daily Target 4 | 54.01 | | Daily Target 5 | 54.1 |
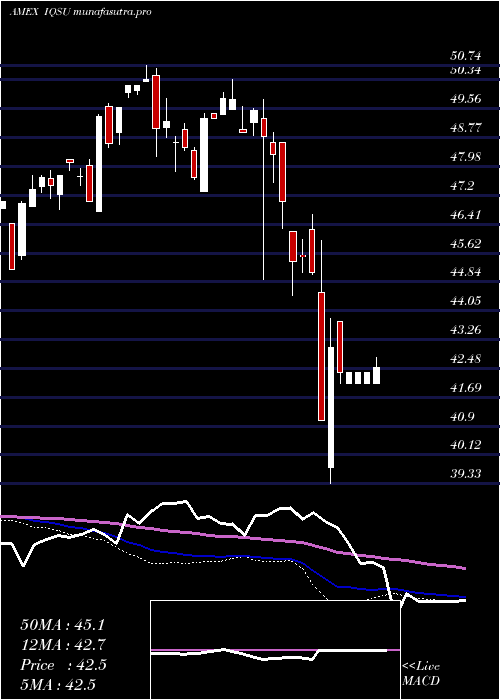
Daily price and volume Iq Candriam
| Date |
Closing |
Open |
Range |
Volume |
Thu 23 October 2025 |
53.93 (0.56%) |
53.71 |
53.68 - 53.93 |
0.0954 times |
Wed 22 October 2025 |
53.63 (-0.69%) |
54.00 |
53.57 - 54.00 |
0.066 times |
Tue 21 October 2025 |
54.00 (0.19%) |
53.99 |
53.99 - 54.05 |
0.2927 times |
Mon 20 October 2025 |
53.90 (1.47%) |
53.65 |
53.65 - 53.90 |
0.1066 times |
Fri 17 October 2025 |
53.12 (0.95%) |
52.79 |
52.79 - 53.25 |
0.3852 times |
Thu 16 October 2025 |
52.62 (-0.81%) |
52.56 |
52.50 - 52.69 |
8.6406 times |
Wed 15 October 2025 |
53.05 (0.38%) |
53.15 |
52.75 - 53.46 |
0.1018 times |
Tue 14 October 2025 |
52.85 (0.42%) |
52.17 |
52.17 - 53.01 |
0.0445 times |
Mon 13 October 2025 |
52.63 (1.33%) |
52.48 |
52.47 - 52.70 |
0.0827 times |
Fri 10 October 2025 |
51.94 (-2.46%) |
53.31 |
51.94 - 53.43 |
0.1845 times |
Thu 09 October 2025 |
53.25 (-0.8%) |
53.39 |
53.18 - 53.39 |
2.1123 times |

Weekly price and charts IqCandriam Strong weekly Stock price targets for IqCandriam IQSU are 53.75 and 54.23 | Weekly Target 1 | 53.37 | | Weekly Target 2 | 53.65 | | Weekly Target 3 | 53.85 | | Weekly Target 4 | 54.13 | | Weekly Target 5 | 54.33 |
Weekly price and volumes for Iq Candriam
| Date |
Closing |
Open |
Range |
Volume |
Thu 23 October 2025 |
53.93 (1.52%) |
53.65 |
53.57 - 54.05 |
0.3462 times |
Fri 17 October 2025 |
53.12 (2.27%) |
52.48 |
52.17 - 53.46 |
5.7137 times |
Fri 10 October 2025 |
51.94 (-2.61%) |
53.71 |
51.94 - 53.78 |
1.5974 times |
Fri 03 October 2025 |
53.33 (0.58%) |
53.16 |
52.93 - 53.48 |
0.3907 times |
Fri 26 September 2025 |
53.02 (0.17%) |
53.12 |
52.48 - 53.23 |
0.3967 times |
Fri 19 September 2025 |
52.93 (1.61%) |
52.47 |
52.26 - 52.93 |
0.3064 times |
Fri 12 September 2025 |
52.09 (0.99%) |
51.58 |
51.24 - 52.12 |
0.3339 times |
Fri 05 September 2025 |
51.58 (0.53%) |
50.82 |
50.73 - 51.89 |
0.4949 times |
Fri 29 August 2025 |
51.31 (0%) |
51.41 |
51.31 - 51.41 |
0.0079 times |
Fri 29 August 2025 |
51.31 (0.21%) |
51.13 |
50.90 - 51.53 |
0.4124 times |
Fri 22 August 2025 |
51.20 (0.89%) |
50.81 |
50.36 - 51.33 |
0.4831 times |
Monthly price and charts IqCandriam Strong monthly Stock price targets for IqCandriam IQSU are 52.94 and 55.05 | Monthly Target 1 | 51.2 | | Monthly Target 2 | 52.56 | | Monthly Target 3 | 53.306666666667 | | Monthly Target 4 | 54.67 | | Monthly Target 5 | 55.42 |
Monthly price and volumes Iq Candriam
| Date |
Closing |
Open |
Range |
Volume |
Thu 23 October 2025 |
53.93 (1.39%) |
53.18 |
51.94 - 54.05 |
0.5492 times |
Tue 30 September 2025 |
53.19 (3.66%) |
50.82 |
50.73 - 53.23 |
0.1189 times |
Fri 29 August 2025 |
51.31 (2.91%) |
49.73 |
49.03 - 51.53 |
5.7082 times |
Thu 31 July 2025 |
49.86 (0.54%) |
49.61 |
46.09 - 50.75 |
0.3045 times |
Mon 30 June 2025 |
49.59 (3.25%) |
47.59 |
47.59 - 49.59 |
0.7917 times |
Fri 30 May 2025 |
48.03 (6.71%) |
45.66 |
45.26 - 48.48 |
1.1785 times |
Wed 30 April 2025 |
45.01 (-0.77%) |
45.13 |
39.33 - 45.95 |
0.1781 times |
Mon 31 March 2025 |
45.36 (-6.09%) |
48.63 |
44.47 - 48.63 |
0.3227 times |
Fri 28 February 2025 |
48.30 (-3.05%) |
49.00 |
44.90 - 49.81 |
0.5147 times |
Fri 31 January 2025 |
49.82 (2.91%) |
47.90 |
47.31 - 50.36 |
0.3334 times |
Tue 31 December 2024 |
48.41 (-3.53%) |
50.31 |
48.27 - 50.74 |
0.5743 times |

DMA SMA EMA moving averages of Iq Candriam IQSU
DMA (daily moving average) of Iq Candriam IQSU
| DMA period | DMA value | | 5 day DMA | 53.72 | | 12 day DMA | 53.22 | | 20 day DMA | 53.26 | | 35 day DMA | 52.85 | | 50 day DMA | 52.32 | | 100 day DMA | 50.9 | | 150 day DMA | 48.96 | | 200 day DMA | 48.79 | EMA (exponential moving average) of Iq Candriam IQSU
| EMA period | EMA current | EMA prev | EMA prev2 | | 5 day EMA | 53.67 | 53.54 | 53.49 | | 12 day EMA | 53.4 | 53.3 | 53.24 | | 20 day EMA | 53.19 | 53.11 | 53.05 | | 35 day EMA | 52.76 | 52.69 | 52.63 | | 50 day EMA | 52.33 | 52.26 | 52.2 |
SMA (simple moving average) of Iq Candriam IQSU
| SMA period | SMA current | SMA prev | SMA prev2 | | 5 day SMA | 53.72 | 53.45 | 53.34 | | 12 day SMA | 53.22 | 53.18 | 53.19 | | 20 day SMA | 53.26 | 53.19 | 53.15 | | 35 day SMA | 52.85 | 52.79 | 52.73 | | 50 day SMA | 52.32 | 52.26 | 52.21 | | 100 day SMA | 50.9 | 50.84 | 50.78 | | 150 day SMA | 48.96 | 48.9 | 48.85 | | 200 day SMA | 48.79 | 48.76 | 48.73 |
|
|
