FlexsharesInternational IQDY full analysis,charts,indicators,moving averages,SMA,DMA,EMA,ADX,MACD,RSIFlexshares International IQDY WideScreen charts, DMA,SMA,EMA technical analysis, forecast prediction, by indicators ADX,MACD,RSI,CCI AMEX stock exchange
Daily price and charts and targets FlexsharesInternational Strong Daily Stock price targets for FlexsharesInternational IQDY are 34.6 and 34.79 | Daily Target 1 | 34.44 | | Daily Target 2 | 34.56 | | Daily Target 3 | 34.633333333333 | | Daily Target 4 | 34.75 | | Daily Target 5 | 34.82 |
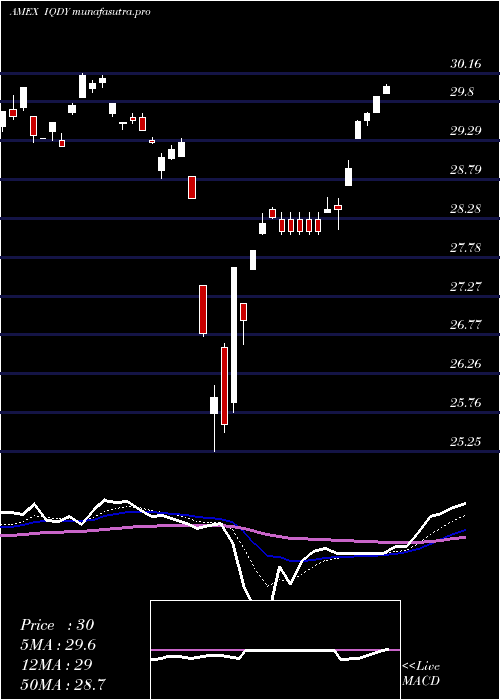
Daily price and volume Flexshares International
| Date |
Closing |
Open |
Range |
Volume |
Thu 23 October 2025 |
34.67 (0.96%) |
34.52 |
34.52 - 34.71 |
0.2499 times |
Wed 22 October 2025 |
34.34 (-0.29%) |
34.35 |
34.24 - 34.48 |
1.8371 times |
Tue 21 October 2025 |
34.44 (-0.66%) |
34.60 |
34.41 - 34.60 |
1.1312 times |
Mon 20 October 2025 |
34.67 (0.99%) |
34.47 |
34.47 - 34.69 |
1.3411 times |
Fri 17 October 2025 |
34.33 (0%) |
34.34 |
34.33 - 34.34 |
0.0663 times |
Thu 16 October 2025 |
34.33 (0.35%) |
34.33 |
34.30 - 34.49 |
0.0956 times |
Wed 15 October 2025 |
34.21 (1.03%) |
34.22 |
34.20 - 34.27 |
0.2914 times |
Tue 14 October 2025 |
33.86 (0.09%) |
33.73 |
33.73 - 33.98 |
0.4456 times |
Mon 13 October 2025 |
33.83 (1.44%) |
33.75 |
33.75 - 33.91 |
3.9762 times |
Fri 10 October 2025 |
33.35 (-2.66%) |
34.15 |
33.35 - 34.15 |
0.5656 times |
Thu 09 October 2025 |
34.26 (-0.35%) |
34.43 |
34.14 - 34.43 |
1.1312 times |
Weekly price and charts FlexsharesInternational Strong weekly Stock price targets for FlexsharesInternational IQDY are 34.46 and 34.93 | Weekly Target 1 | 34.07 | | Weekly Target 2 | 34.37 | | Weekly Target 3 | 34.54 | | Weekly Target 4 | 34.84 | | Weekly Target 5 | 35.01 |
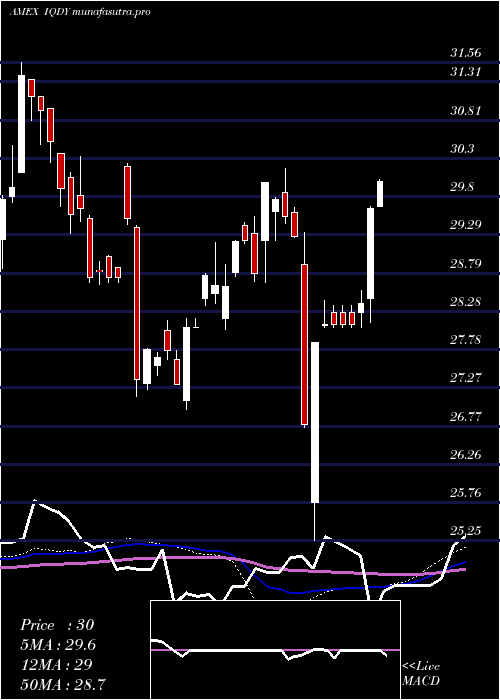
Weekly price and volumes for Flexshares International
| Date |
Closing |
Open |
Range |
Volume |
Thu 23 October 2025 |
34.67 (0.99%) |
34.47 |
34.24 - 34.71 |
0.8969 times |
Fri 17 October 2025 |
34.33 (2.94%) |
33.75 |
33.73 - 34.49 |
0.9591 times |
Fri 10 October 2025 |
33.35 (-3.14%) |
34.52 |
33.35 - 34.65 |
0.6878 times |
Fri 03 October 2025 |
34.43 (2.32%) |
33.79 |
33.71 - 34.49 |
0.7634 times |
Fri 26 September 2025 |
33.65 (-0.62%) |
33.86 |
33.41 - 34.12 |
2.3973 times |
Fri 19 September 2025 |
33.86 (-0.59%) |
34.28 |
33.81 - 34.44 |
0.8159 times |
Fri 12 September 2025 |
34.06 (2.04%) |
33.74 |
33.63 - 34.27 |
1.5813 times |
Fri 05 September 2025 |
33.38 (0.3%) |
32.85 |
32.85 - 33.63 |
0.7317 times |
Fri 29 August 2025 |
33.28 (0%) |
33.25 |
33.06 - 33.28 |
0.2933 times |
Fri 29 August 2025 |
33.28 (-1.71%) |
33.81 |
33.06 - 33.81 |
0.8733 times |
Fri 22 August 2025 |
33.86 (0.71%) |
33.57 |
33.40 - 33.90 |
0.8025 times |
Monthly price and charts FlexsharesInternational Strong monthly Stock price targets for FlexsharesInternational IQDY are 34.01 and 35.37 | Monthly Target 1 | 32.88 | | Monthly Target 2 | 33.78 | | Monthly Target 3 | 34.243333333333 | | Monthly Target 4 | 35.14 | | Monthly Target 5 | 35.6 |
Monthly price and volumes Flexshares International
| Date |
Closing |
Open |
Range |
Volume |
Thu 23 October 2025 |
34.67 (2.15%) |
34.00 |
33.35 - 34.71 |
0.5299 times |
Tue 30 September 2025 |
33.94 (1.98%) |
32.85 |
32.85 - 34.44 |
1.1249 times |
Fri 29 August 2025 |
33.28 (3.16%) |
31.82 |
31.82 - 33.90 |
1.0529 times |
Thu 31 July 2025 |
32.26 (-0.22%) |
32.00 |
31.85 - 33.56 |
0.8519 times |
Mon 30 June 2025 |
32.33 (2.63%) |
31.60 |
30.83 - 32.51 |
0.7864 times |
Fri 30 May 2025 |
31.50 (5.35%) |
29.86 |
29.86 - 31.80 |
0.9392 times |
Wed 30 April 2025 |
29.90 (2.86%) |
29.06 |
25.25 - 30.02 |
1.2338 times |
Mon 31 March 2025 |
29.07 (1.01%) |
29.22 |
28.66 - 30.16 |
1.0903 times |
Fri 28 February 2025 |
28.78 (0.56%) |
28.19 |
28.04 - 29.53 |
0.8319 times |
Fri 31 January 2025 |
28.62 (3.51%) |
27.63 |
26.99 - 29.19 |
1.5589 times |
Tue 31 December 2024 |
27.65 (-3.76%) |
30.19 |
27.16 - 30.23 |
2.1923 times |

DMA SMA EMA moving averages of Flexshares International IQDY
DMA (daily moving average) of Flexshares International IQDY
| DMA period | DMA value | | 5 day DMA | 34.49 | | 12 day DMA | 34.22 | | 20 day DMA | 34.18 | | 35 day DMA | 34.09 | | 50 day DMA | 33.89 | | 100 day DMA | 33.13 | | 150 day DMA | 31.94 | | 200 day DMA | 31.18 | EMA (exponential moving average) of Flexshares International IQDY
| EMA period | EMA current | EMA prev | EMA prev2 | | 5 day EMA | 34.47 | 34.37 | 34.38 | | 12 day EMA | 34.32 | 34.26 | 34.24 | | 20 day EMA | 34.21 | 34.16 | 34.14 | | 35 day EMA | 34.06 | 34.02 | 34 | | 50 day EMA | 33.89 | 33.86 | 33.84 |
SMA (simple moving average) of Flexshares International IQDY
| SMA period | SMA current | SMA prev | SMA prev2 | | 5 day SMA | 34.49 | 34.42 | 34.4 | | 12 day SMA | 34.22 | 34.19 | 34.21 | | 20 day SMA | 34.18 | 34.12 | 34.09 | | 35 day SMA | 34.09 | 34.05 | 34.01 | | 50 day SMA | 33.89 | 33.86 | 33.85 | | 100 day SMA | 33.13 | 33.1 | 33.07 | | 150 day SMA | 31.94 | 31.91 | 31.88 | | 200 day SMA | 31.18 | 31.14 | 31.11 |
|
|
