FlexsharesInternational IQDF full analysis,charts,indicators,moving averages,SMA,DMA,EMA,ADX,MACD,RSIFlexshares International IQDF WideScreen charts, DMA,SMA,EMA technical analysis, forecast prediction, by indicators ADX,MACD,RSI,CCI AMEX stock exchange
Daily price and charts and targets FlexsharesInternational Strong Daily Stock price targets for FlexsharesInternational IQDF are 28.88 and 29.06 | Daily Target 1 | 28.74 | | Daily Target 2 | 28.84 | | Daily Target 3 | 28.916666666667 | | Daily Target 4 | 29.02 | | Daily Target 5 | 29.1 |
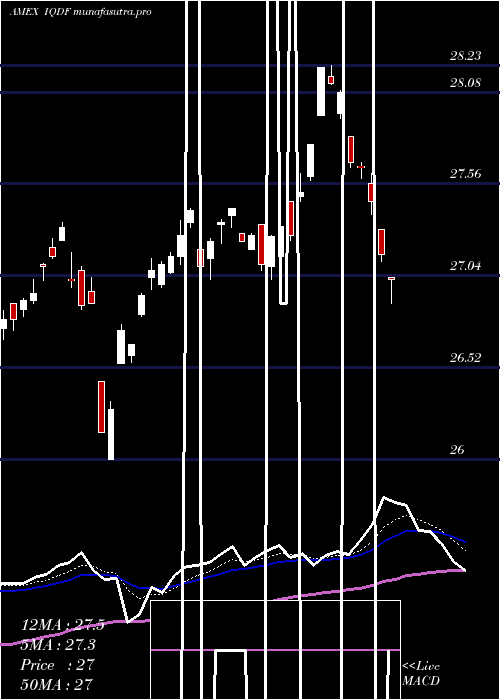
Daily price and volume Flexshares International
| Date |
Closing |
Open |
Range |
Volume |
Thu 23 October 2025 |
28.95 (0.73%) |
28.81 |
28.81 - 28.99 |
0.5105 times |
Wed 22 October 2025 |
28.74 (0%) |
28.72 |
28.63 - 28.81 |
1.1445 times |
Tue 21 October 2025 |
28.74 (-0.55%) |
28.81 |
28.72 - 28.87 |
1.212 times |
Mon 20 October 2025 |
28.90 (0.42%) |
28.82 |
28.75 - 28.93 |
1.7593 times |
Fri 17 October 2025 |
28.78 (0.66%) |
28.59 |
28.59 - 28.78 |
0.3607 times |
Thu 16 October 2025 |
28.59 (0.11%) |
28.75 |
28.59 - 28.84 |
1.8287 times |
Wed 15 October 2025 |
28.56 (0.71%) |
28.56 |
28.41 - 28.62 |
0.688 times |
Tue 14 October 2025 |
28.36 (0.11%) |
28.16 |
28.15 - 28.47 |
0.695 times |
Mon 13 October 2025 |
28.33 (1.5%) |
28.28 |
28.23 - 28.38 |
0.4879 times |
Fri 10 October 2025 |
27.91 (-2.45%) |
28.54 |
27.91 - 28.59 |
1.3135 times |
Thu 09 October 2025 |
28.61 (-0.52%) |
28.85 |
28.54 - 28.85 |
0.6449 times |
Weekly price and charts FlexsharesInternational Strong weekly Stock price targets for FlexsharesInternational IQDF are 28.79 and 29.15 | Weekly Target 1 | 28.5 | | Weekly Target 2 | 28.72 | | Weekly Target 3 | 28.856666666667 | | Weekly Target 4 | 29.08 | | Weekly Target 5 | 29.22 |
Weekly price and volumes for Flexshares International
| Date |
Closing |
Open |
Range |
Volume |
Thu 23 October 2025 |
28.95 (0.59%) |
28.82 |
28.63 - 28.99 |
1.1613 times |
Fri 17 October 2025 |
28.78 (3.12%) |
28.28 |
28.15 - 28.84 |
1.0192 times |
Fri 10 October 2025 |
27.91 (-3.33%) |
28.90 |
27.91 - 28.95 |
0.8311 times |
Fri 03 October 2025 |
28.87 (1.69%) |
28.43 |
28.39 - 28.96 |
1.3639 times |
Fri 26 September 2025 |
28.39 (-0.46%) |
28.47 |
28.08 - 28.68 |
1.4131 times |
Fri 19 September 2025 |
28.52 (-0.77%) |
28.81 |
28.50 - 29.08 |
1.0499 times |
Fri 12 September 2025 |
28.74 (1.52%) |
28.45 |
28.38 - 28.83 |
1.254 times |
Fri 05 September 2025 |
28.31 (0.32%) |
27.90 |
27.90 - 28.45 |
0.88 times |
Fri 29 August 2025 |
28.22 (0%) |
28.14 |
28.14 - 28.23 |
0.1842 times |
Fri 29 August 2025 |
28.22 (-1.64%) |
28.56 |
28.09 - 28.62 |
0.8433 times |
Fri 22 August 2025 |
28.69 (1.06%) |
28.34 |
28.23 - 28.72 |
1.5387 times |
Monthly price and charts FlexsharesInternational Strong monthly Stock price targets for FlexsharesInternational IQDF are 28.43 and 29.51 | Monthly Target 1 | 27.54 | | Monthly Target 2 | 28.24 | | Monthly Target 3 | 28.616666666667 | | Monthly Target 4 | 29.32 | | Monthly Target 5 | 29.7 |
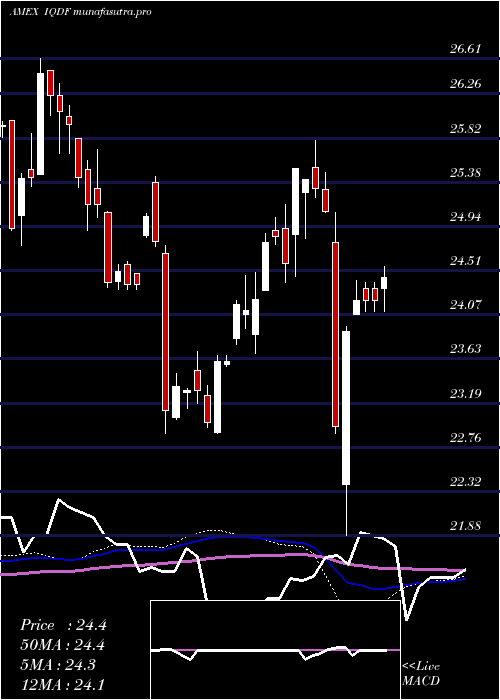
Monthly price and volumes Flexshares International
| Date |
Closing |
Open |
Range |
Volume |
Thu 23 October 2025 |
28.95 (1.44%) |
28.60 |
27.91 - 28.99 |
0.7324 times |
Tue 30 September 2025 |
28.54 (1.13%) |
27.90 |
27.90 - 29.08 |
1.0833 times |
Fri 29 August 2025 |
28.22 (3.9%) |
27.03 |
26.88 - 28.72 |
0.9158 times |
Thu 31 July 2025 |
27.16 (0.22%) |
27.06 |
27.02 - 28.23 |
1.1111 times |
Mon 30 June 2025 |
27.10 (1.69%) |
26.74 |
26.00 - 27.34 |
1.0957 times |
Fri 30 May 2025 |
26.65 (4.1%) |
25.56 |
25.45 - 26.97 |
0.9951 times |
Wed 30 April 2025 |
25.60 (2.69%) |
24.93 |
21.88 - 25.97 |
1.423 times |
Mon 31 March 2025 |
24.93 (1.42%) |
24.86 |
24.45 - 25.80 |
0.9315 times |
Fri 28 February 2025 |
24.58 (1.95%) |
23.87 |
23.68 - 25.16 |
0.7403 times |
Fri 31 January 2025 |
24.11 (3.61%) |
23.24 |
22.89 - 24.46 |
0.9719 times |
Tue 31 December 2024 |
23.27 (-4.51%) |
24.85 |
22.89 - 25.44 |
1.315 times |

DMA SMA EMA moving averages of Flexshares International IQDF
DMA (daily moving average) of Flexshares International IQDF
| DMA period | DMA value | | 5 day DMA | 28.82 | | 12 day DMA | 28.6 | | 20 day DMA | 28.62 | | 35 day DMA | 28.62 | | 50 day DMA | 28.53 | | 100 day DMA | 27.91 | | 150 day DMA | 27.04 | | 200 day DMA | 26.39 | EMA (exponential moving average) of Flexshares International IQDF
| EMA period | EMA current | EMA prev | EMA prev2 | | 5 day EMA | 28.8 | 28.72 | 28.71 | | 12 day EMA | 28.7 | 28.65 | 28.63 | | 20 day EMA | 28.63 | 28.6 | 28.59 | | 35 day EMA | 28.57 | 28.55 | 28.54 | | 50 day EMA | 28.53 | 28.51 | 28.5 |
SMA (simple moving average) of Flexshares International IQDF
| SMA period | SMA current | SMA prev | SMA prev2 | | 5 day SMA | 28.82 | 28.75 | 28.71 | | 12 day SMA | 28.6 | 28.58 | 28.59 | | 20 day SMA | 28.62 | 28.59 | 28.57 | | 35 day SMA | 28.62 | 28.6 | 28.58 | | 50 day SMA | 28.53 | 28.51 | 28.51 | | 100 day SMA | 27.91 | 27.89 | 27.87 | | 150 day SMA | 27.04 | 27.01 | 26.99 | | 200 day SMA | 26.39 | 26.36 | 26.34 |
|
|
