CorePacific IPAC full analysis,charts,indicators,moving averages,SMA,DMA,EMA,ADX,MACD,RSICore Pacific IPAC WideScreen charts, DMA,SMA,EMA technical analysis, forecast prediction, by indicators ADX,MACD,RSI,CCI AMEX stock exchange
Daily price and charts and targets CorePacific Strong Daily Stock price targets for CorePacific IPAC are 74.3 and 74.64 | Daily Target 1 | 74.05 | | Daily Target 2 | 74.21 | | Daily Target 3 | 74.386666666667 | | Daily Target 4 | 74.55 | | Daily Target 5 | 74.73 |
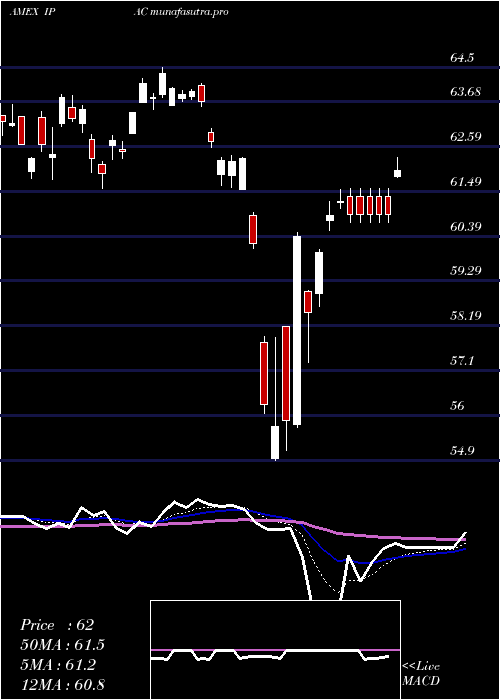
Daily price and volume Core Pacific
| Date |
Closing |
Open |
Range |
Volume |
Thu 23 October 2025 |
74.38 (0.32%) |
74.29 |
74.22 - 74.56 |
0.2425 times |
Wed 22 October 2025 |
74.14 (-0.42%) |
74.35 |
73.84 - 74.42 |
0.2085 times |
Tue 21 October 2025 |
74.45 (-1%) |
74.63 |
74.32 - 74.69 |
4.0686 times |
Mon 20 October 2025 |
75.20 (1.55%) |
74.85 |
74.85 - 75.29 |
0.407 times |
Fri 17 October 2025 |
74.05 (0.27%) |
73.78 |
73.72 - 74.10 |
0.3086 times |
Thu 16 October 2025 |
73.85 (0.26%) |
74.12 |
73.58 - 74.21 |
3.1331 times |
Wed 15 October 2025 |
73.66 (1.1%) |
73.66 |
73.38 - 73.90 |
0.4006 times |
Tue 14 October 2025 |
72.86 (0.68%) |
72.12 |
72.01 - 73.17 |
0.2327 times |
Mon 13 October 2025 |
72.37 (-2.79%) |
72.13 |
72.04 - 72.50 |
0.2591 times |
Tue 07 October 2025 |
74.45 (-1.19%) |
74.94 |
74.41 - 74.95 |
0.7394 times |
Mon 06 October 2025 |
75.35 (0.98%) |
75.29 |
75.28 - 75.62 |
0.2827 times |
Weekly price and charts CorePacific Strong weekly Stock price targets for CorePacific IPAC are 73.39 and 74.84 | Weekly Target 1 | 73.05 | | Weekly Target 2 | 73.72 | | Weekly Target 3 | 74.503333333333 | | Weekly Target 4 | 75.17 | | Weekly Target 5 | 75.95 |
Weekly price and volumes for Core Pacific
| Date |
Closing |
Open |
Range |
Volume |
Thu 23 October 2025 |
74.38 (0.45%) |
74.85 |
73.84 - 75.29 |
1.8383 times |
Fri 17 October 2025 |
74.05 (-0.54%) |
72.13 |
72.01 - 74.21 |
1.6173 times |
Tue 07 October 2025 |
74.45 (-0.23%) |
75.29 |
74.41 - 75.62 |
0.3814 times |
Fri 03 October 2025 |
74.62 (1.77%) |
73.63 |
73.20 - 74.80 |
2.2179 times |
Fri 26 September 2025 |
73.32 (-0.62%) |
73.86 |
72.90 - 74.24 |
0.5113 times |
Fri 19 September 2025 |
73.78 (-0.5%) |
74.44 |
73.66 - 74.76 |
0.8131 times |
Fri 12 September 2025 |
74.15 (1.87%) |
73.76 |
73.19 - 74.70 |
0.5511 times |
Fri 05 September 2025 |
72.79 (0.75%) |
71.53 |
71.50 - 73.27 |
1.5772 times |
Fri 29 August 2025 |
72.25 (0%) |
72.27 |
72.14 - 72.39 |
0.0722 times |
Fri 29 August 2025 |
72.25 (-1.46%) |
72.86 |
71.81 - 72.98 |
0.4203 times |
Fri 22 August 2025 |
73.32 (0.78%) |
72.93 |
72.07 - 73.39 |
1.6516 times |

Monthly price and charts CorePacific Strong monthly Stock price targets for CorePacific IPAC are 73.2 and 76.81 | Monthly Target 1 | 70.39 | | Monthly Target 2 | 72.39 | | Monthly Target 3 | 74.003333333333 | | Monthly Target 4 | 76 | | Monthly Target 5 | 77.61 |
Monthly price and volumes Core Pacific
| Date |
Closing |
Open |
Range |
Volume |
Thu 23 October 2025 |
74.38 (1.29%) |
73.72 |
72.01 - 75.62 |
0.9242 times |
Tue 30 September 2025 |
73.43 (1.63%) |
71.53 |
71.50 - 74.76 |
0.5891 times |
Fri 29 August 2025 |
72.25 (6.02%) |
68.44 |
67.94 - 73.39 |
0.4834 times |
Thu 31 July 2025 |
68.15 (-0.8%) |
68.52 |
66.71 - 70.49 |
0.6721 times |
Mon 30 June 2025 |
68.70 (1.81%) |
67.89 |
65.51 - 68.91 |
3.0537 times |
Fri 30 May 2025 |
67.48 (4.07%) |
64.74 |
64.44 - 68.08 |
0.8124 times |
Wed 30 April 2025 |
64.84 (4.18%) |
61.87 |
54.90 - 65.06 |
1.4541 times |
Mon 31 March 2025 |
62.24 (-0.06%) |
63.29 |
61.54 - 64.50 |
0.6443 times |
Fri 28 February 2025 |
62.28 (0.21%) |
61.41 |
61.32 - 63.87 |
0.5588 times |
Fri 31 January 2025 |
62.15 (1.72%) |
61.07 |
59.12 - 63.13 |
0.8079 times |
Tue 31 December 2024 |
61.10 (-3.11%) |
65.12 |
59.92 - 65.28 |
0.5231 times |

DMA SMA EMA moving averages of Core Pacific IPAC
DMA (daily moving average) of Core Pacific IPAC
| DMA period | DMA value | | 5 day DMA | 74.44 | | 12 day DMA | 74.12 | | 20 day DMA | 73.86 | | 35 day DMA | 73.76 | | 50 day DMA | 73.4 | | 100 day DMA | 70.79 | | 150 day DMA | 68.29 | | 200 day DMA | 66.77 | EMA (exponential moving average) of Core Pacific IPAC
| EMA period | EMA current | EMA prev | EMA prev2 | | 5 day EMA | 74.29 | 74.25 | 74.31 | | 12 day EMA | 74.11 | 74.06 | 74.04 | | 20 day EMA | 73.95 | 73.9 | 73.88 | | 35 day EMA | 73.57 | 73.52 | 73.48 | | 50 day EMA | 73.27 | 73.22 | 73.18 |
SMA (simple moving average) of Core Pacific IPAC
| SMA period | SMA current | SMA prev | SMA prev2 | | 5 day SMA | 74.44 | 74.34 | 74.24 | | 12 day SMA | 74.12 | 74.04 | 73.99 | | 20 day SMA | 73.86 | 73.84 | 73.83 | | 35 day SMA | 73.76 | 73.7 | 73.65 | | 50 day SMA | 73.4 | 73.33 | 73.28 | | 100 day SMA | 70.79 | 70.73 | 70.65 | | 150 day SMA | 68.29 | 68.22 | 68.15 | | 200 day SMA | 66.77 | 66.71 | 66.64 |
|
|
