SP IOO full analysis,charts,indicators,moving averages,SMA,DMA,EMA,ADX,MACD,RSIS P IOO WideScreen charts, DMA,SMA,EMA technical analysis, forecast prediction, by indicators ADX,MACD,RSI,CCI AMEX stock exchange
Daily price and charts and targets SP Strong Daily Stock price targets for SP IOO are 121.3 and 122.11 | Daily Target 1 | 120.66 | | Daily Target 2 | 121.13 | | Daily Target 3 | 121.47333333333 | | Daily Target 4 | 121.94 | | Daily Target 5 | 122.28 |
Daily price and volume S P
| Date |
Closing |
Open |
Range |
Volume |
Thu 23 October 2025 |
121.59 (0.58%) |
121.32 |
121.01 - 121.82 |
0.7179 times |
Wed 22 October 2025 |
120.89 (-0.36%) |
121.44 |
119.99 - 121.55 |
1.1327 times |
Tue 21 October 2025 |
121.33 (-0.21%) |
121.55 |
121.04 - 121.63 |
0.9329 times |
Mon 20 October 2025 |
121.59 (0.95%) |
120.87 |
120.81 - 121.86 |
0.4588 times |
Fri 17 October 2025 |
120.44 (0.45%) |
119.49 |
119.20 - 120.62 |
1.6568 times |
Thu 16 October 2025 |
119.90 (-0.08%) |
120.43 |
119.26 - 121.00 |
0.9543 times |
Wed 15 October 2025 |
119.99 (0.49%) |
120.36 |
119.02 - 120.78 |
1.0373 times |
Tue 14 October 2025 |
119.40 (-0.62%) |
118.94 |
117.87 - 119.97 |
1.2739 times |
Mon 13 October 2025 |
120.14 (-0.93%) |
119.76 |
119.45 - 120.39 |
1.0391 times |
Tue 07 October 2025 |
121.27 (-0.42%) |
121.78 |
121.00 - 121.88 |
0.7963 times |
Mon 06 October 2025 |
121.78 (0.26%) |
121.00 |
121.00 - 121.94 |
1.1113 times |
Weekly price and charts SP Strong weekly Stock price targets for SP IOO are 120.79 and 122.66 | Weekly Target 1 | 119.28 | | Weekly Target 2 | 120.43 | | Weekly Target 3 | 121.14666666667 | | Weekly Target 4 | 122.3 | | Weekly Target 5 | 123.02 |
Weekly price and volumes for S P
| Date |
Closing |
Open |
Range |
Volume |
Thu 23 October 2025 |
121.59 (0.95%) |
120.87 |
119.99 - 121.86 |
0.6437 times |
Fri 17 October 2025 |
120.44 (-0.68%) |
119.76 |
117.87 - 121.00 |
1.1835 times |
Tue 07 October 2025 |
121.27 (-0.16%) |
121.00 |
121.00 - 121.94 |
0.3787 times |
Fri 03 October 2025 |
121.46 (2.12%) |
119.31 |
118.93 - 121.96 |
1.5541 times |
Fri 26 September 2025 |
118.94 (-0.11%) |
119.05 |
117.62 - 120.10 |
1.6163 times |
Fri 19 September 2025 |
119.07 (1.35%) |
117.85 |
117.05 - 119.21 |
1.5318 times |
Fri 12 September 2025 |
117.48 (1.78%) |
115.96 |
115.85 - 117.76 |
0.6563 times |
Fri 05 September 2025 |
115.43 (0.59%) |
113.06 |
112.68 - 116.54 |
0.9391 times |
Fri 29 August 2025 |
114.75 (0%) |
115.19 |
114.39 - 115.19 |
0.2541 times |
Fri 29 August 2025 |
114.75 (-0.02%) |
114.67 |
114.00 - 115.79 |
1.2424 times |
Fri 22 August 2025 |
114.77 (-0.1%) |
114.62 |
112.61 - 115.03 |
0.9677 times |
Monthly price and charts SP Strong monthly Stock price targets for SP IOO are 119.73 and 123.82 | Monthly Target 1 | 116.38 | | Monthly Target 2 | 118.99 | | Monthly Target 3 | 120.47333333333 | | Monthly Target 4 | 123.08 | | Monthly Target 5 | 124.56 |
Monthly price and volumes S P
| Date |
Closing |
Open |
Range |
Volume |
Thu 23 October 2025 |
121.59 (1.32%) |
119.73 |
117.87 - 121.96 |
0.5352 times |
Tue 30 September 2025 |
120.01 (4.58%) |
113.06 |
112.68 - 120.10 |
0.7763 times |
Fri 29 August 2025 |
114.75 (2.79%) |
110.40 |
109.21 - 115.79 |
0.8814 times |
Thu 31 July 2025 |
111.63 (3.54%) |
107.58 |
107.19 - 113.28 |
0.6492 times |
Mon 30 June 2025 |
107.81 (4.84%) |
102.58 |
102.38 - 108.00 |
0.6695 times |
Fri 30 May 2025 |
102.83 (6.96%) |
97.35 |
96.08 - 103.65 |
0.8228 times |
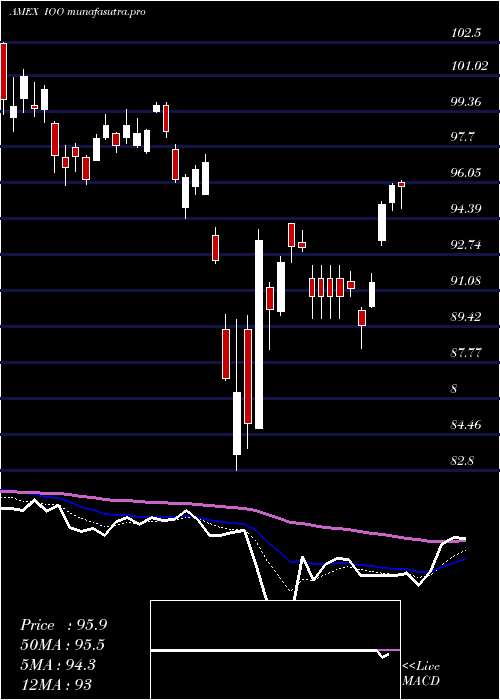
Wed 30 April 2025 |
96.14 (-0.16%) |
95.89 |
82.80 - 97.37 |
1.8888 times |
Mon 31 March 2025 |
96.29 (-5.43%) |
102.46 |
94.39 - 102.50 |
0.9428 times |
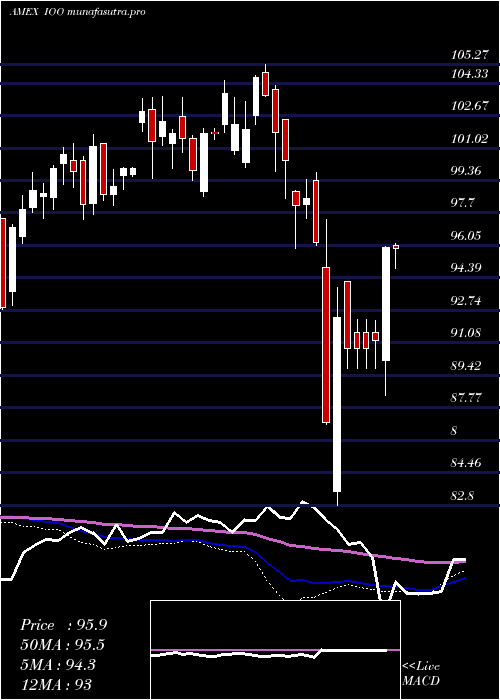
Fri 28 February 2025 |
101.82 (-0.39%) |
100.29 |
99.82 - 105.27 |
0.874 times |
Fri 31 January 2025 |
102.22 (1.44%) |
101.37 |
98.54 - 104.47 |
1.9601 times |
Tue 31 December 2024 |
100.77 (0.78%) |
102.31 |
99.49 - 103.66 |
0.8475 times |

DMA SMA EMA moving averages of S P IOO
DMA (daily moving average) of S P IOO
| DMA period | DMA value | | 5 day DMA | 121.17 | | 12 day DMA | 120.82 | | 20 day DMA | 120.31 | | 35 day DMA | 118.93 | | 50 day DMA | 117.61 | | 100 day DMA | 112.83 | | 150 day DMA | 107.28 | | 200 day DMA | 105.87 | EMA (exponential moving average) of S P IOO
| EMA period | EMA current | EMA prev | EMA prev2 | | 5 day EMA | 121.13 | 120.9 | 120.9 | | 12 day EMA | 120.7 | 120.54 | 120.48 | | 20 day EMA | 120.14 | 119.99 | 119.89 | | 35 day EMA | 118.86 | 118.7 | 118.57 | | 50 day EMA | 117.55 | 117.38 | 117.24 |
SMA (simple moving average) of S P IOO
| SMA period | SMA current | SMA prev | SMA prev2 | | 5 day SMA | 121.17 | 120.83 | 120.65 | | 12 day SMA | 120.82 | 120.78 | 120.79 | | 20 day SMA | 120.31 | 120.23 | 120.14 | | 35 day SMA | 118.93 | 118.73 | 118.56 | | 50 day SMA | 117.61 | 117.44 | 117.29 | | 100 day SMA | 112.83 | 112.64 | 112.44 | | 150 day SMA | 107.28 | 107.12 | 106.95 | | 200 day SMA | 105.87 | 105.77 | 105.67 |
|
|
