InfusystemsHoldings INFU full analysis,charts,indicators,moving averages,SMA,DMA,EMA,ADX,MACD,RSIInfusystems Holdings INFU WideScreen charts, DMA,SMA,EMA technical analysis, forecast prediction, by indicators ADX,MACD,RSI,CCI AMEX stock exchange
Daily price and charts and targets InfusystemsHoldings Strong Daily Stock price targets for InfusystemsHoldings INFU are 10.09 and 10.39 | Daily Target 1 | 9.86 | | Daily Target 2 | 10.02 | | Daily Target 3 | 10.156666666667 | | Daily Target 4 | 10.32 | | Daily Target 5 | 10.46 |
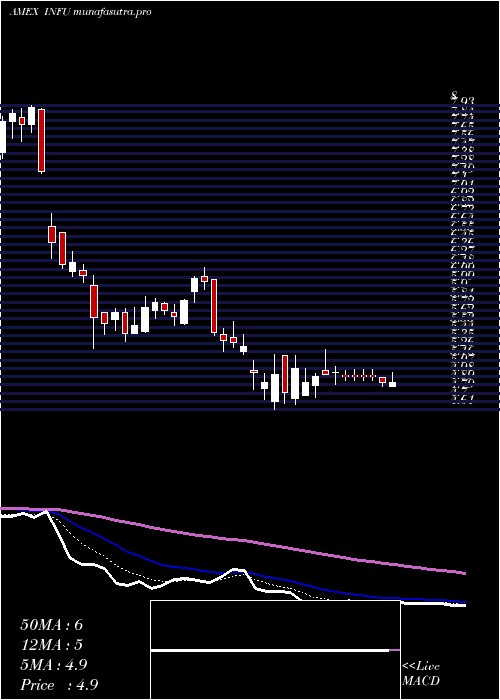
Daily price and volume Infusystems Holdings
| Date |
Closing |
Open |
Range |
Volume |
Fri 24 October 2025 |
10.19 (1.6%) |
10.16 |
9.99 - 10.29 |
0.7828 times |
Thu 23 October 2025 |
10.03 (3.19%) |
9.98 |
9.67 - 10.18 |
0.9055 times |
Wed 22 October 2025 |
9.72 (0.41%) |
9.68 |
9.66 - 10.06 |
1.3514 times |
Tue 21 October 2025 |
9.68 (0.41%) |
9.63 |
9.49 - 9.73 |
0.9436 times |
Mon 20 October 2025 |
9.64 (7.11%) |
9.19 |
9.12 - 9.68 |
1.0221 times |
Fri 17 October 2025 |
9.00 (-3.12%) |
9.19 |
8.98 - 9.35 |
0.8677 times |
Thu 16 October 2025 |
9.29 (-2.31%) |
9.75 |
9.18 - 9.96 |
0.6402 times |
Wed 15 October 2025 |
9.51 (4.05%) |
9.20 |
9.15 - 9.56 |
1.2361 times |
Tue 14 October 2025 |
9.14 (-0.87%) |
9.10 |
8.95 - 9.25 |
0.8823 times |
Mon 13 October 2025 |
9.22 (-0.11%) |
9.27 |
8.96 - 9.40 |
1.3682 times |
Fri 10 October 2025 |
9.23 (-3.95%) |
9.61 |
9.11 - 9.76 |
2.1619 times |
Weekly price and charts InfusystemsHoldings Strong weekly Stock price targets for InfusystemsHoldings INFU are 9.66 and 10.83 | Weekly Target 1 | 8.7 | | Weekly Target 2 | 9.44 | | Weekly Target 3 | 9.8666666666667 | | Weekly Target 4 | 10.61 | | Weekly Target 5 | 11.04 |
Weekly price and volumes for Infusystems Holdings
| Date |
Closing |
Open |
Range |
Volume |
Fri 24 October 2025 |
10.19 (13.22%) |
9.19 |
9.12 - 10.29 |
0.5666 times |
Fri 17 October 2025 |
9.00 (-2.49%) |
9.27 |
8.95 - 9.96 |
0.5654 times |
Fri 10 October 2025 |
9.23 (-10.91%) |
10.38 |
9.11 - 10.67 |
1.2122 times |
Fri 03 October 2025 |
10.36 (0.19%) |
10.43 |
10.01 - 10.96 |
1.0229 times |
Fri 26 September 2025 |
10.34 (3.4%) |
10.00 |
10.00 - 10.64 |
1.15 times |
Fri 19 September 2025 |
10.00 (0.1%) |
10.00 |
9.73 - 10.33 |
1.1744 times |
Fri 12 September 2025 |
9.99 (-1.67%) |
10.17 |
9.90 - 10.57 |
1.188 times |
Fri 05 September 2025 |
10.16 (-5.75%) |
10.70 |
10.05 - 10.81 |
0.8682 times |
Fri 29 August 2025 |
10.78 (0%) |
10.88 |
10.56 - 11.04 |
0.2864 times |
Fri 29 August 2025 |
10.78 (12.64%) |
9.60 |
9.59 - 11.04 |
1.9658 times |
Fri 22 August 2025 |
9.57 (-0.62%) |
9.65 |
9.32 - 9.89 |
1.0929 times |

Monthly price and charts InfusystemsHoldings Strong monthly Stock price targets for InfusystemsHoldings INFU are 8.57 and 10.58 | Monthly Target 1 | 8.02 | | Monthly Target 2 | 9.11 | | Monthly Target 3 | 10.033333333333 | | Monthly Target 4 | 11.12 | | Monthly Target 5 | 12.04 |
Monthly price and volumes Infusystems Holdings
| Date |
Closing |
Open |
Range |
Volume |
Fri 24 October 2025 |
10.19 (-1.64%) |
10.24 |
8.95 - 10.96 |
0.8753 times |
Tue 30 September 2025 |
10.36 (-3.9%) |
10.70 |
9.73 - 10.81 |
1.4152 times |
Fri 29 August 2025 |
10.78 (92.5%) |
5.51 |
5.43 - 11.04 |
2.0185 times |
Thu 31 July 2025 |
5.60 (-10.26%) |
6.22 |
5.38 - 6.40 |
0.6173 times |
Mon 30 June 2025 |
6.24 (7.96%) |
5.73 |
5.63 - 6.53 |
1.5583 times |
Fri 30 May 2025 |
5.78 (22.46%) |
4.76 |
4.67 - 6.24 |
0.9717 times |
Wed 30 April 2025 |
4.72 (-12.27%) |
5.42 |
4.61 - 5.59 |
0.7073 times |
Mon 31 March 2025 |
5.38 (-32.58%) |
7.95 |
5.26 - 7.97 |
0.7814 times |
Fri 28 February 2025 |
7.98 (-1.36%) |
8.11 |
7.41 - 8.88 |
0.5757 times |
Fri 31 January 2025 |
8.09 (-4.26%) |
8.45 |
7.42 - 8.80 |
0.4792 times |
Tue 31 December 2024 |
8.45 (-5.59%) |
9.04 |
7.54 - 9.74 |
0.295 times |

DMA SMA EMA moving averages of Infusystems Holdings INFU
DMA (daily moving average) of Infusystems Holdings INFU
| DMA period | DMA value | | 5 day DMA | 9.85 | | 12 day DMA | 9.52 | | 20 day DMA | 9.82 | | 35 day DMA | 9.96 | | 50 day DMA | 10.02 | | 100 day DMA | 8.23 | | 150 day DMA | 7.24 | | 200 day DMA | 7.3 | EMA (exponential moving average) of Infusystems Holdings INFU
| EMA period | EMA current | EMA prev | EMA prev2 | | 5 day EMA | 9.88 | 9.72 | 9.57 | | 12 day EMA | 9.75 | 9.67 | 9.6 | | 20 day EMA | 9.77 | 9.73 | 9.7 | | 35 day EMA | 9.83 | 9.81 | 9.8 | | 50 day EMA | 9.95 | 9.94 | 9.94 |
SMA (simple moving average) of Infusystems Holdings INFU
| SMA period | SMA current | SMA prev | SMA prev2 | | 5 day SMA | 9.85 | 9.61 | 9.47 | | 12 day SMA | 9.52 | 9.49 | 9.5 | | 20 day SMA | 9.82 | 9.83 | 9.83 | | 35 day SMA | 9.96 | 9.96 | 9.98 | | 50 day SMA | 10.02 | 10.01 | 10 | | 100 day SMA | 8.23 | 8.18 | 8.14 | | 150 day SMA | 7.24 | 7.21 | 7.18 | | 200 day SMA | 7.3 | 7.29 | 7.28 |
|
|
