PacerBenchmark INDS full analysis,charts,indicators,moving averages,SMA,DMA,EMA,ADX,MACD,RSIPacer Benchmark INDS WideScreen charts, DMA,SMA,EMA technical analysis, forecast prediction, by indicators ADX,MACD,RSI,CCI AMEX stock exchange
Daily price and charts and targets PacerBenchmark Strong Daily Stock price targets for PacerBenchmark INDS are 39.46 and 39.74 | Daily Target 1 | 39.41 | | Daily Target 2 | 39.51 | | Daily Target 3 | 39.686666666667 | | Daily Target 4 | 39.79 | | Daily Target 5 | 39.97 |
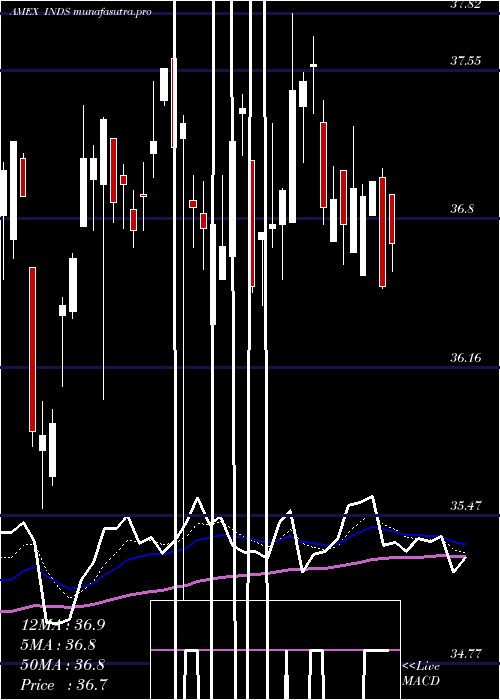
Daily price and volume Pacer Benchmark
| Date |
Closing |
Open |
Range |
Volume |
Fri 24 October 2025 |
39.62 (-0.38%) |
39.86 |
39.58 - 39.86 |
0.8227 times |
Thu 23 October 2025 |
39.77 (0%) |
39.94 |
39.52 - 39.94 |
0.6532 times |
Wed 22 October 2025 |
39.77 (0.45%) |
39.66 |
39.66 - 39.86 |
0.8378 times |
Tue 21 October 2025 |
39.59 (-0.33%) |
39.74 |
39.52 - 39.83 |
1.2426 times |
Mon 20 October 2025 |
39.72 (1.25%) |
39.50 |
39.37 - 39.75 |
1.3767 times |
Fri 17 October 2025 |
39.23 (0.54%) |
39.00 |
38.93 - 39.37 |
0.5567 times |
Thu 16 October 2025 |
39.02 (0.93%) |
38.75 |
38.75 - 39.29 |
2.2834 times |
Wed 15 October 2025 |
38.66 (1.55%) |
38.14 |
38.13 - 38.75 |
0.7262 times |
Tue 14 October 2025 |
38.07 (1.22%) |
37.54 |
37.54 - 38.17 |
0.71 times |
Mon 13 October 2025 |
37.61 (0.16%) |
37.21 |
37.12 - 37.61 |
0.7907 times |
Tue 07 October 2025 |
37.55 (-0.24%) |
37.58 |
37.46 - 37.71 |
1.7025 times |
Weekly price and charts PacerBenchmark Strong weekly Stock price targets for PacerBenchmark INDS are 39.5 and 40.07 | Weekly Target 1 | 39.07 | | Weekly Target 2 | 39.35 | | Weekly Target 3 | 39.643333333333 | | Weekly Target 4 | 39.92 | | Weekly Target 5 | 40.21 |
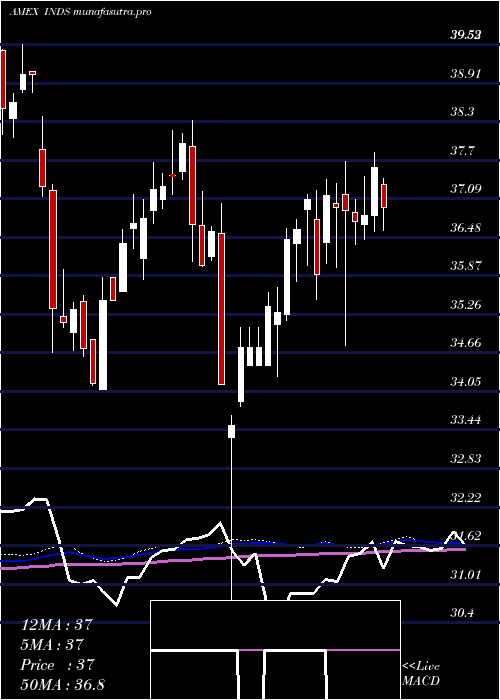
Weekly price and volumes for Pacer Benchmark
| Date |
Closing |
Open |
Range |
Volume |
Fri 24 October 2025 |
39.62 (0.99%) |
39.50 |
39.37 - 39.94 |
0.962 times |
Fri 17 October 2025 |
39.23 (4.47%) |
37.21 |
37.12 - 39.37 |
0.9882 times |
Tue 07 October 2025 |
37.55 (-0.71%) |
37.79 |
37.46 - 37.83 |
0.5921 times |
Fri 03 October 2025 |
37.82 (2.22%) |
37.04 |
36.34 - 38.08 |
0.6869 times |
Fri 26 September 2025 |
37.00 (0.6%) |
36.58 |
36.43 - 37.01 |
1.0511 times |
Fri 19 September 2025 |
36.78 (-1.76%) |
37.72 |
36.78 - 37.83 |
1.6774 times |
Fri 12 September 2025 |
37.44 (-0.11%) |
37.48 |
36.03 - 37.63 |
1.3831 times |
Fri 05 September 2025 |
37.48 (-0.43%) |
37.08 |
36.54 - 37.69 |
1.6774 times |
Fri 29 August 2025 |
37.64 (0%) |
37.42 |
37.42 - 37.64 |
0.1684 times |
Fri 29 August 2025 |
37.64 (0.19%) |
37.47 |
37.07 - 37.64 |
0.8135 times |
Fri 22 August 2025 |
37.57 (3.87%) |
36.14 |
35.88 - 37.81 |
0.8387 times |
Monthly price and charts PacerBenchmark Strong monthly Stock price targets for PacerBenchmark INDS are 38.37 and 41.19 | Monthly Target 1 | 36.07 | | Monthly Target 2 | 37.85 | | Monthly Target 3 | 38.893333333333 | | Monthly Target 4 | 40.67 | | Monthly Target 5 | 41.71 |
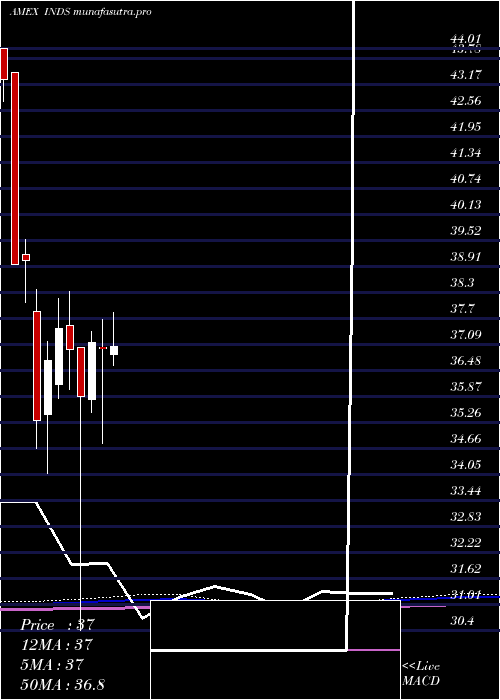
Monthly price and volumes Pacer Benchmark
| Date |
Closing |
Open |
Range |
Volume |
Fri 24 October 2025 |
39.62 (6.48%) |
37.20 |
37.12 - 39.94 |
0.4358 times |
Tue 30 September 2025 |
37.21 (-1.14%) |
37.08 |
36.03 - 37.83 |
0.9019 times |
Fri 29 August 2025 |
37.64 (6.21%) |
35.41 |
35.19 - 37.81 |
0.6818 times |
Thu 31 July 2025 |
35.44 (-4.19%) |
36.84 |
33.61 - 38.37 |
1.3897 times |
Mon 30 June 2025 |
36.99 (-0.4%) |
37.02 |
34.77 - 37.67 |
0.7146 times |
Fri 30 May 2025 |
37.14 (3.54%) |
35.79 |
35.50 - 37.39 |
1.1749 times |
Wed 30 April 2025 |
35.87 (-2.98%) |
37.02 |
30.40 - 37.02 |
0.9428 times |
Mon 31 March 2025 |
36.97 (-1.28%) |
37.52 |
36.02 - 38.33 |
0.7584 times |
Fri 28 February 2025 |
37.45 (2.04%) |
36.14 |
35.82 - 38.17 |
1.0039 times |
Fri 31 January 2025 |
36.70 (3.97%) |
35.45 |
34.07 - 37.16 |
1.9962 times |
Tue 31 December 2024 |
35.30 (-9.6%) |
37.86 |
34.66 - 38.38 |
1.639 times |
DMA SMA EMA moving averages of Pacer Benchmark INDS
DMA (daily moving average) of Pacer Benchmark INDS
| DMA period | DMA value | | 5 day DMA | 39.69 | | 12 day DMA | 38.85 | | 20 day DMA | 38.18 | | 35 day DMA | 37.75 | | 50 day DMA | 37.49 | | 100 day DMA | 37.16 | | 150 day DMA | 36.66 | | 200 day DMA | 36.65 | EMA (exponential moving average) of Pacer Benchmark INDS
| EMA period | EMA current | EMA prev | EMA prev2 | | 5 day EMA | 39.55 | 39.52 | 39.39 | | 12 day EMA | 39 | 38.89 | 38.73 | | 20 day EMA | 38.53 | 38.42 | 38.28 | | 35 day EMA | 38.01 | 37.92 | 37.81 | | 50 day EMA | 37.58 | 37.5 | 37.41 |
SMA (simple moving average) of Pacer Benchmark INDS
| SMA period | SMA current | SMA prev | SMA prev2 | | 5 day SMA | 39.69 | 39.62 | 39.47 | | 12 day SMA | 38.85 | 38.7 | 38.51 | | 20 day SMA | 38.18 | 38.05 | 37.91 | | 35 day SMA | 37.75 | 37.67 | 37.61 | | 50 day SMA | 37.49 | 37.42 | 37.34 | | 100 day SMA | 37.16 | 37.13 | 37.09 | | 150 day SMA | 36.66 | 36.65 | 36.63 | | 200 day SMA | 36.65 | 36.63 | 36.61 |
|
|
