IndiaIndex INDA full analysis,charts,indicators,moving averages,SMA,DMA,EMA,ADX,MACD,RSIIndia Index INDA WideScreen charts, DMA,SMA,EMA technical analysis, forecast prediction, by indicators ADX,MACD,RSI,CCI AMEX stock exchange
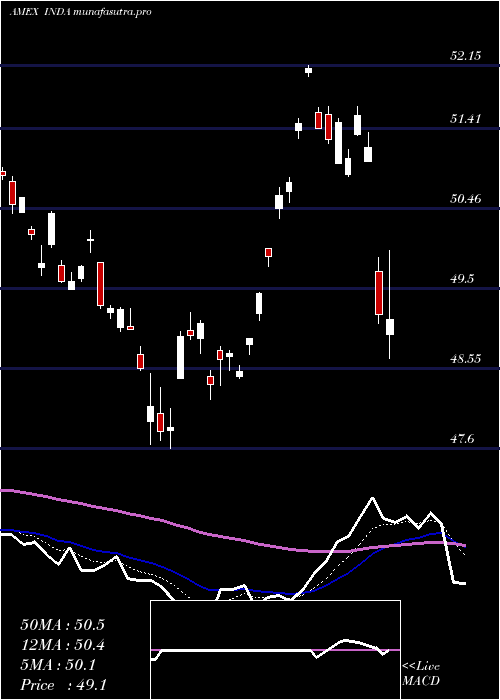
Daily price and charts and targets IndiaIndex Strong Daily Stock price targets for IndiaIndex INDA are 54.2 and 55.07 | Daily Target 1 | 54.01 | | Daily Target 2 | 54.38 | | Daily Target 3 | 54.876666666667 | | Daily Target 4 | 55.25 | | Daily Target 5 | 55.75 |
Daily price and volume India Index
| Date |
Closing |
Open |
Range |
Volume |
Thu 23 October 2025 |
54.76 (-0.89%) |
55.15 |
54.50 - 55.37 |
0.9473 times |
Wed 22 October 2025 |
55.25 (1.41%) |
55.37 |
55.13 - 55.50 |
1.6897 times |
Tue 21 October 2025 |
54.48 (-0.49%) |
54.48 |
54.40 - 54.59 |
0.5705 times |
Mon 20 October 2025 |
54.75 (0.55%) |
54.50 |
54.49 - 54.77 |
1.4178 times |
Fri 17 October 2025 |
54.45 (0.7%) |
54.27 |
54.25 - 54.53 |
0.8195 times |
Thu 16 October 2025 |
54.07 (0.58%) |
54.11 |
53.94 - 54.59 |
1.0496 times |
Wed 15 October 2025 |
53.76 (1.86%) |
53.54 |
53.47 - 53.79 |
1.4907 times |
Tue 14 October 2025 |
52.78 (-0.36%) |
52.74 |
52.60 - 52.90 |
0.5977 times |
Mon 13 October 2025 |
52.97 (0.17%) |
53.00 |
52.86 - 53.06 |
0.8619 times |
Tue 07 October 2025 |
52.88 (0.23%) |
52.97 |
52.85 - 52.97 |
0.5552 times |
Mon 06 October 2025 |
52.76 (0.59%) |
52.65 |
52.65 - 52.84 |
0.4801 times |
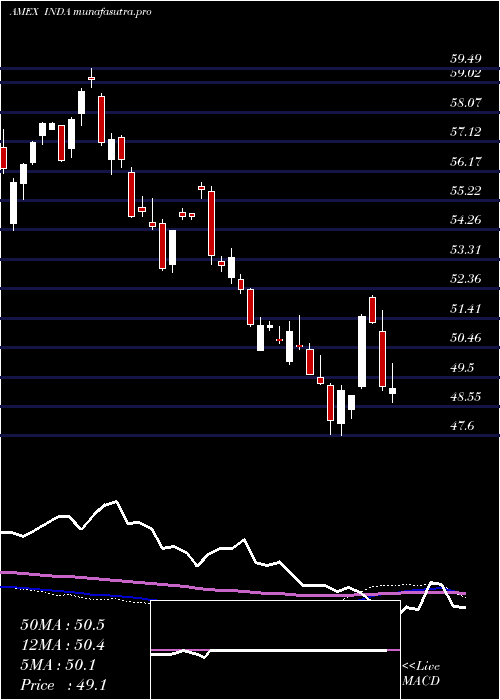
Weekly price and charts IndiaIndex Strong weekly Stock price targets for IndiaIndex INDA are 54.58 and 55.68 | Weekly Target 1 | 53.79 | | Weekly Target 2 | 54.27 | | Weekly Target 3 | 54.886666666667 | | Weekly Target 4 | 55.37 | | Weekly Target 5 | 55.99 |
Weekly price and volumes for India Index
| Date |
Closing |
Open |
Range |
Volume |
Thu 23 October 2025 |
54.76 (0.57%) |
54.50 |
54.40 - 55.50 |
1.3624 times |
Fri 17 October 2025 |
54.45 (2.97%) |
53.00 |
52.60 - 54.59 |
1.4196 times |
Tue 07 October 2025 |
52.88 (0.82%) |
52.65 |
52.65 - 52.97 |
0.305 times |
Fri 03 October 2025 |
52.45 (0.38%) |
52.21 |
51.98 - 52.64 |
1.0056 times |
Fri 26 September 2025 |
52.25 (-3.13%) |
53.64 |
52.06 - 53.65 |
0.9383 times |
Fri 19 September 2025 |
53.94 (1.49%) |
53.37 |
53.33 - 54.45 |
1.2625 times |
Fri 12 September 2025 |
53.15 (1.28%) |
52.78 |
52.69 - 53.33 |
1.0305 times |
Fri 05 September 2025 |
52.48 (0.96%) |
52.11 |
52.10 - 52.71 |
1.115 times |
Fri 29 August 2025 |
51.98 (0%) |
52.00 |
51.83 - 52.01 |
0.2508 times |
Fri 29 August 2025 |
51.98 (-2.99%) |
53.42 |
51.83 - 53.48 |
1.3103 times |
Fri 22 August 2025 |
53.58 (1.65%) |
53.23 |
53.23 - 54.09 |
1.8 times |
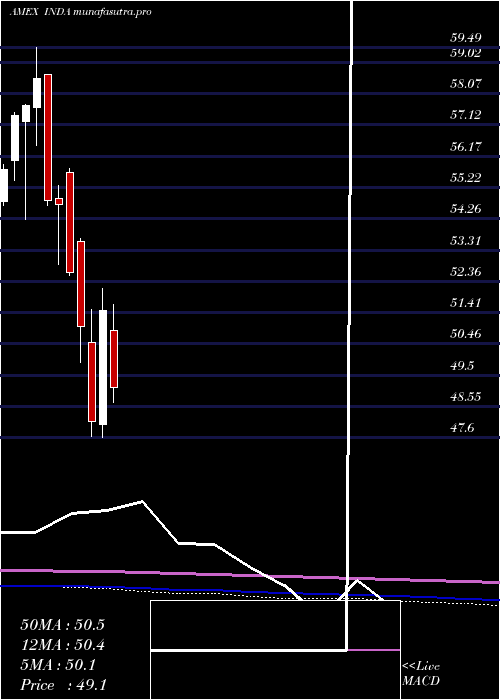
Monthly price and charts IndiaIndex Strong monthly Stock price targets for IndiaIndex INDA are 53.38 and 56.88 | Monthly Target 1 | 50.59 | | Monthly Target 2 | 52.67 | | Monthly Target 3 | 54.086666666667 | | Monthly Target 4 | 56.17 | | Monthly Target 5 | 57.59 |
Monthly price and volumes India Index
| Date |
Closing |
Open |
Range |
Volume |
Thu 23 October 2025 |
54.76 (5.19%) |
52.46 |
52.00 - 55.50 |
0.5561 times |
Tue 30 September 2025 |
52.06 (0.15%) |
52.11 |
51.98 - 54.45 |
0.7231 times |
Fri 29 August 2025 |
51.98 (-1.25%) |
52.73 |
51.83 - 54.09 |
1.0549 times |
Thu 31 July 2025 |
52.64 (-5.46%) |
55.75 |
52.61 - 55.87 |
1.1095 times |
Mon 30 June 2025 |
55.68 (2.52%) |
54.38 |
53.71 - 56.01 |
0.8773 times |
Fri 30 May 2025 |
54.31 (1.38%) |
53.65 |
51.25 - 54.81 |
1.276 times |
Wed 30 April 2025 |
53.57 (4.06%) |
50.86 |
48.55 - 53.78 |
1.5848 times |
Mon 31 March 2025 |
51.48 (7.03%) |
48.02 |
47.60 - 52.15 |
0.9944 times |
Fri 28 February 2025 |
48.10 (-5.67%) |
50.51 |
47.65 - 51.50 |
0.9071 times |
Fri 31 January 2025 |
50.99 (-3.13%) |
53.58 |
49.91 - 53.68 |
0.9169 times |
Tue 31 December 2024 |
52.64 (-3.78%) |
55.66 |
52.53 - 55.79 |
0.5768 times |
DMA SMA EMA moving averages of India Index INDA
DMA (daily moving average) of India Index INDA
| DMA period | DMA value | | 5 day DMA | 54.74 | | 12 day DMA | 53.78 | | 20 day DMA | 53.24 | | 35 day DMA | 53.21 | | 50 day DMA | 53.12 | | 100 day DMA | 53.75 | | 150 day DMA | 53.27 | | 200 day DMA | 52.5 | EMA (exponential moving average) of India Index INDA
| EMA period | EMA current | EMA prev | EMA prev2 | | 5 day EMA | 54.63 | 54.56 | 54.22 | | 12 day EMA | 54.03 | 53.9 | 53.65 | | 20 day EMA | 53.68 | 53.57 | 53.39 | | 35 day EMA | 53.34 | 53.26 | 53.14 | | 50 day EMA | 53.22 | 53.16 | 53.07 |
SMA (simple moving average) of India Index INDA
| SMA period | SMA current | SMA prev | SMA prev2 | | 5 day SMA | 54.74 | 54.6 | 54.3 | | 12 day SMA | 53.78 | 53.58 | 53.34 | | 20 day SMA | 53.24 | 53.18 | 53.11 | | 35 day SMA | 53.21 | 53.13 | 53.04 | | 50 day SMA | 53.12 | 53.07 | 53 | | 100 day SMA | 53.75 | 53.75 | 53.74 | | 150 day SMA | 53.27 | 53.23 | 53.18 | | 200 day SMA | 52.5 | 52.5 | 52.48 |
|
|
