SP IJH full analysis,charts,indicators,moving averages,SMA,DMA,EMA,ADX,MACD,RSIS P IJH WideScreen charts, DMA,SMA,EMA technical analysis, forecast prediction, by indicators ADX,MACD,RSI,CCI AMEX stock exchange
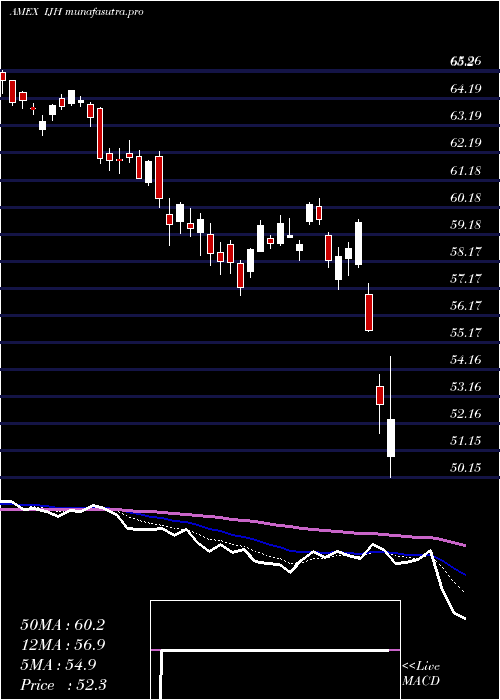
Daily price and charts and targets SP Strong Daily Stock price targets for SP IJH are 66.31 and 66.93 | Daily Target 1 | 65.82 | | Daily Target 2 | 66.17 | | Daily Target 3 | 66.44 | | Daily Target 4 | 66.79 | | Daily Target 5 | 67.06 |
Daily price and volume S P
| Date |
Closing |
Open |
Range |
Volume |
Thu 04 December 2025 |
66.52 (0.5%) |
66.17 |
66.09 - 66.71 |
0.7015 times |
Wed 03 December 2025 |
66.19 (0.7%) |
65.70 |
65.66 - 66.27 |
0.7841 times |
Tue 02 December 2025 |
65.73 (-0.35%) |
66.10 |
65.71 - 66.28 |
0.6953 times |
Mon 01 December 2025 |
65.96 (-0.57%) |
65.66 |
65.66 - 66.44 |
0.8057 times |
Fri 28 November 2025 |
66.34 (0.52%) |
66.16 |
65.98 - 66.42 |
0.4963 times |
Wed 26 November 2025 |
66.00 (0.63%) |
65.70 |
65.53 - 66.45 |
0.6788 times |
Tue 25 November 2025 |
65.59 (1.86%) |
64.54 |
64.41 - 65.68 |
1.0064 times |
Mon 24 November 2025 |
64.39 (0.99%) |
63.86 |
63.71 - 64.58 |
0.8426 times |
Fri 21 November 2025 |
63.76 (2.41%) |
62.56 |
62.42 - 64.14 |
1.7751 times |
Thu 20 November 2025 |
62.26 (-1.64%) |
64.04 |
62.22 - 64.37 |
2.2141 times |
Wed 19 November 2025 |
63.30 (0.16%) |
63.32 |
62.95 - 63.68 |
1.1982 times |
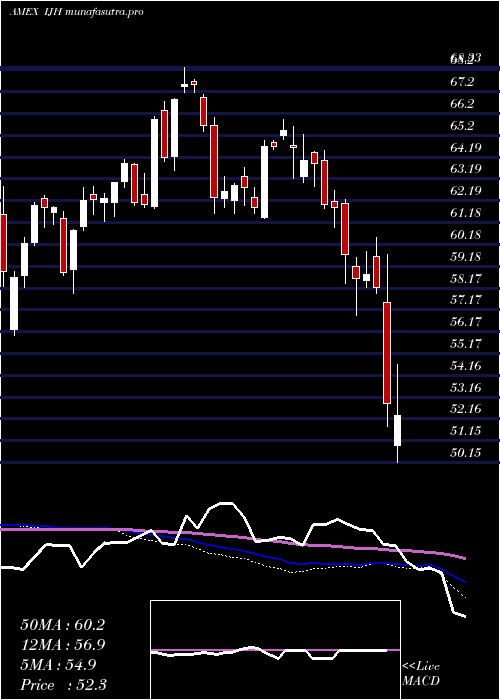
Weekly price and charts SP Strong weekly Stock price targets for SP IJH are 66.09 and 67.14 | Weekly Target 1 | 65.25 | | Weekly Target 2 | 65.88 | | Weekly Target 3 | 66.296666666667 | | Weekly Target 4 | 66.93 | | Weekly Target 5 | 67.35 |
Weekly price and volumes for S P
| Date |
Closing |
Open |
Range |
Volume |
Thu 04 December 2025 |
66.52 (0.27%) |
65.66 |
65.66 - 66.71 |
0.6698 times |
Fri 28 November 2025 |
66.34 (4.05%) |
63.86 |
63.71 - 66.45 |
0.6782 times |
Fri 21 November 2025 |
63.76 (-0.69%) |
64.10 |
62.22 - 64.37 |
1.806 times |
Fri 14 November 2025 |
64.20 (-1.11%) |
65.45 |
63.56 - 65.95 |
1.2186 times |
Fri 07 November 2025 |
64.92 (-0.02%) |
64.14 |
63.72 - 65.20 |
1.1299 times |
Fri 31 October 2025 |
64.93 (0%) |
64.69 |
64.39 - 65.10 |
0.2357 times |
Fri 31 October 2025 |
64.93 (-1.61%) |
66.52 |
64.39 - 66.57 |
1.1621 times |
Fri 24 October 2025 |
65.99 (2.36%) |
64.69 |
64.47 - 66.45 |
0.9757 times |
Fri 17 October 2025 |
64.47 (-1.04%) |
64.03 |
63.82 - 65.82 |
1.7162 times |
Tue 07 October 2025 |
65.15 (-0.94%) |
66.09 |
64.95 - 66.19 |
0.4079 times |
Fri 03 October 2025 |
65.77 (0.66%) |
65.67 |
64.67 - 66.17 |
0.9289 times |
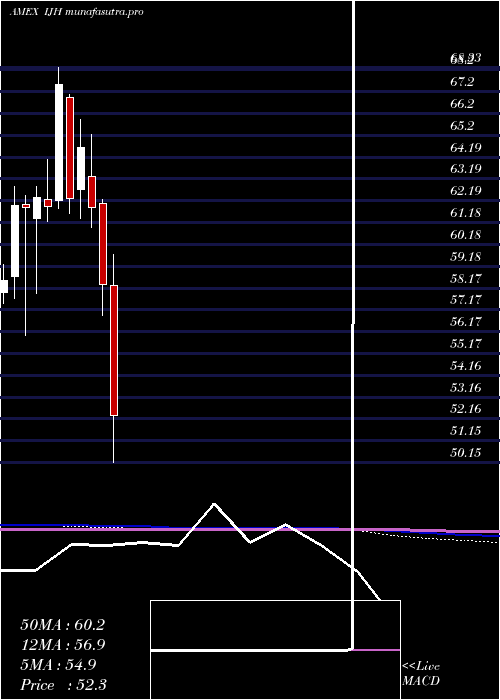
Monthly price and charts SP Strong monthly Stock price targets for SP IJH are 66.09 and 67.14 | Monthly Target 1 | 65.25 | | Monthly Target 2 | 65.88 | | Monthly Target 3 | 66.296666666667 | | Monthly Target 4 | 66.93 | | Monthly Target 5 | 67.35 |
Monthly price and volumes S P
| Date |
Closing |
Open |
Range |
Volume |
Thu 04 December 2025 |
66.52 (0.27%) |
65.66 |
65.66 - 66.71 |
0.1594 times |
Fri 28 November 2025 |
66.34 (2.17%) |
64.14 |
62.22 - 66.45 |
1.1504 times |
Fri 31 October 2025 |
64.93 (-0.51%) |
65.04 |
63.82 - 66.57 |
1.2072 times |
Tue 30 September 2025 |
65.26 (0.15%) |
64.46 |
64.27 - 66.62 |
0.9849 times |
Fri 29 August 2025 |
65.16 (3.38%) |
62.33 |
61.29 - 65.64 |
0.8081 times |
Thu 31 July 2025 |
63.03 (1.63%) |
61.84 |
61.74 - 64.62 |
0.836 times |
Mon 30 June 2025 |
62.02 (3.3%) |
59.95 |
59.14 - 62.43 |
0.8334 times |
Fri 30 May 2025 |
60.04 (5.5%) |
57.29 |
56.84 - 61.82 |
0.9639 times |
Wed 30 April 2025 |
56.91 (-2.47%) |
58.29 |
50.15 - 59.74 |
1.8606 times |
Mon 31 March 2025 |
58.35 (-5.7%) |
62.06 |
56.91 - 62.26 |
1.196 times |
Fri 28 February 2025 |
61.88 (-4.28%) |
63.32 |
60.98 - 65.26 |
0.9357 times |
DMA SMA EMA moving averages of S P IJH
DMA (daily moving average) of S P IJH
| DMA period | DMA value | | 5 day DMA | 66.15 | | 12 day DMA | 64.94 | | 20 day DMA | 64.81 | | 35 day DMA | 64.93 | | 50 day DMA | 65.04 | | 100 day DMA | 64.66 | | 150 day DMA | 63.32 | | 200 day DMA | 62.05 | EMA (exponential moving average) of S P IJH
| EMA period | EMA current | EMA prev | EMA prev2 | | 5 day EMA | 66.05 | 65.81 | 65.62 | | 12 day EMA | 65.44 | 65.24 | 65.07 | | 20 day EMA | 65.17 | 65.03 | 64.91 | | 35 day EMA | 65.08 | 65 | 64.93 | | 50 day EMA | 65.2 | 65.15 | 65.11 |
SMA (simple moving average) of S P IJH
| SMA period | SMA current | SMA prev | SMA prev2 | | 5 day SMA | 66.15 | 66.04 | 65.92 | | 12 day SMA | 64.94 | 64.64 | 64.48 | | 20 day SMA | 64.81 | 64.72 | 64.63 | | 35 day SMA | 64.93 | 64.89 | 64.86 | | 50 day SMA | 65.04 | 65.02 | 65.02 | | 100 day SMA | 64.66 | 64.64 | 64.61 | | 150 day SMA | 63.32 | 63.26 | 63.19 | | 200 day SMA | 62.05 | 62.03 | 62.02 |
|
|
