DjUs IHI full analysis,charts,indicators,moving averages,SMA,DMA,EMA,ADX,MACD,RSIDj Us IHI WideScreen charts, DMA,SMA,EMA technical analysis, forecast prediction, by indicators ADX,MACD,RSI,CCI AMEX stock exchange
Daily price and charts and targets DjUs Strong Daily Stock price targets for DjUs IHI are 61.89 and 62.68 | Daily Target 1 | 61.28 | | Daily Target 2 | 61.71 | | Daily Target 3 | 62.066666666667 | | Daily Target 4 | 62.5 | | Daily Target 5 | 62.86 |
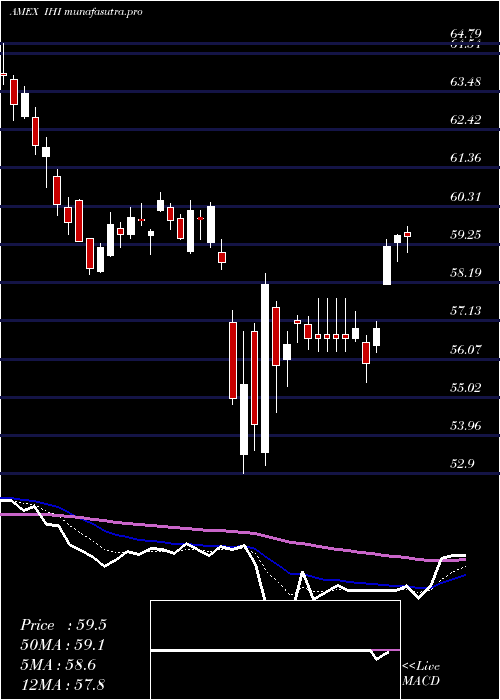
Daily price and volume Dj Us
| Date |
Closing |
Open |
Range |
Volume |
Thu 23 October 2025 |
62.15 (0.05%) |
62.14 |
61.63 - 62.42 |
0.7482 times |
Wed 22 October 2025 |
62.12 (2.66%) |
62.37 |
62.03 - 62.89 |
1.6169 times |
Tue 21 October 2025 |
60.51 (-0.23%) |
60.57 |
60.26 - 60.70 |
0.8413 times |
Mon 20 October 2025 |
60.65 (1.39%) |
59.81 |
59.81 - 60.71 |
2.0732 times |
Fri 17 October 2025 |
59.82 (1.18%) |
59.20 |
59.10 - 59.92 |
0.7086 times |
Thu 16 October 2025 |
59.12 (-0.14%) |
59.29 |
58.81 - 59.69 |
0.7683 times |
Wed 15 October 2025 |
59.20 (-0.42%) |
59.01 |
58.56 - 59.64 |
1.0866 times |
Tue 14 October 2025 |
59.45 (1%) |
58.48 |
58.48 - 59.61 |
0.8549 times |
Mon 13 October 2025 |
58.86 (-1.83%) |
58.93 |
58.71 - 59.32 |
0.5452 times |
Tue 07 October 2025 |
59.96 (-0.58%) |
60.49 |
59.85 - 60.49 |
0.7569 times |
Mon 06 October 2025 |
60.31 (-0.53%) |
60.86 |
60.25 - 60.91 |
0.6299 times |
Weekly price and charts DjUs Strong weekly Stock price targets for DjUs IHI are 60.98 and 64.06 | Weekly Target 1 | 58.54 | | Weekly Target 2 | 60.34 | | Weekly Target 3 | 61.616666666667 | | Weekly Target 4 | 63.42 | | Weekly Target 5 | 64.7 |
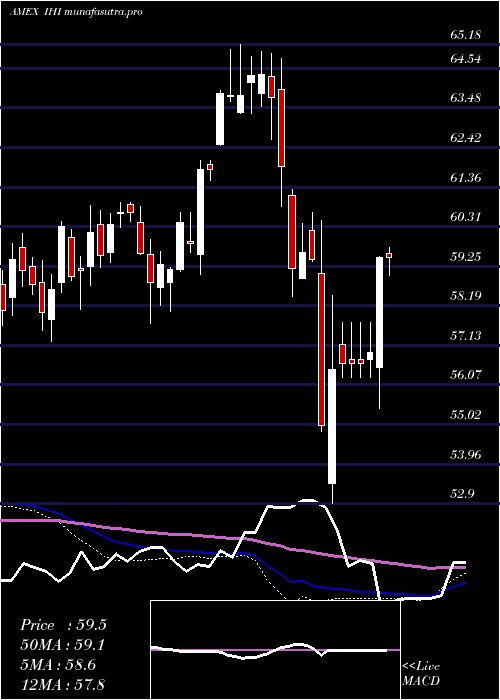
Weekly price and volumes for Dj Us
| Date |
Closing |
Open |
Range |
Volume |
Thu 23 October 2025 |
62.15 (3.9%) |
59.81 |
59.81 - 62.89 |
1.7407 times |
Fri 17 October 2025 |
59.82 (-0.23%) |
58.93 |
58.48 - 59.92 |
1.3069 times |
Tue 07 October 2025 |
59.96 (-1.11%) |
60.86 |
59.85 - 60.91 |
0.4573 times |
Fri 03 October 2025 |
60.63 (1.59%) |
59.75 |
58.18 - 61.11 |
1.6043 times |
Fri 26 September 2025 |
59.68 (-1.08%) |
60.17 |
58.62 - 60.74 |
0.8743 times |
Fri 19 September 2025 |
60.33 (-1.53%) |
61.35 |
59.92 - 61.48 |
1.3839 times |
Fri 12 September 2025 |
61.27 (-1.87%) |
62.40 |
60.64 - 62.81 |
1.2265 times |
Fri 05 September 2025 |
62.44 (0.47%) |
61.71 |
60.61 - 62.66 |
0.7356 times |
Fri 29 August 2025 |
62.15 (0%) |
61.91 |
61.70 - 62.15 |
0.0937 times |
Fri 29 August 2025 |
62.15 (-1.15%) |
62.72 |
61.52 - 62.80 |
0.5767 times |
Fri 22 August 2025 |
62.87 (1.57%) |
61.86 |
61.23 - 62.93 |
0.85 times |
Monthly price and charts DjUs Strong monthly Stock price targets for DjUs IHI are 60.17 and 64.88 | Monthly Target 1 | 56.36 | | Monthly Target 2 | 59.26 | | Monthly Target 3 | 61.073333333333 | | Monthly Target 4 | 63.97 | | Monthly Target 5 | 65.78 |
Monthly price and volumes Dj Us
| Date |
Closing |
Open |
Range |
Volume |
Thu 23 October 2025 |
62.15 (3.45%) |
60.12 |
58.18 - 62.89 |
1.134 times |
Tue 30 September 2025 |
60.08 (-3.33%) |
61.71 |
58.62 - 62.81 |
1.1077 times |
Fri 29 August 2025 |
62.15 (4.12%) |
59.34 |
59.09 - 62.93 |
0.8932 times |
Thu 31 July 2025 |
59.69 (-4.71%) |
62.30 |
59.56 - 62.81 |
1.1369 times |
Mon 30 June 2025 |
62.64 (1.21%) |
61.55 |
59.73 - 62.72 |
0.8875 times |
Fri 30 May 2025 |
61.89 (3.51%) |
59.61 |
58.99 - 63.02 |
0.8706 times |
Wed 30 April 2025 |
59.79 (-0.66%) |
59.97 |
52.90 - 60.42 |
0.9609 times |
Mon 31 March 2025 |
60.19 (-5.61%) |
63.97 |
58.43 - 64.79 |
0.7994 times |
Fri 28 February 2025 |
63.77 (-0.06%) |
63.37 |
62.62 - 65.18 |
0.8767 times |
Fri 31 January 2025 |
63.81 (9.36%) |
58.58 |
58.04 - 65.05 |
1.3331 times |
Tue 31 December 2024 |
58.35 (-3.86%) |
60.40 |
57.72 - 60.85 |
0.5623 times |

DMA SMA EMA moving averages of Dj Us IHI
DMA (daily moving average) of Dj Us IHI
| DMA period | DMA value | | 5 day DMA | 61.05 | | 12 day DMA | 60.23 | | 20 day DMA | 60.06 | | 35 day DMA | 60.57 | | 50 day DMA | 61 | | 100 day DMA | 61.11 | | 150 day DMA | 60.49 | | 200 day DMA | 61.03 | EMA (exponential moving average) of Dj Us IHI
| EMA period | EMA current | EMA prev | EMA prev2 | | 5 day EMA | 61.23 | 60.77 | 60.1 | | 12 day EMA | 60.57 | 60.28 | 59.94 | | 20 day EMA | 60.45 | 60.27 | 60.07 | | 35 day EMA | 60.61 | 60.52 | 60.43 | | 50 day EMA | 60.99 | 60.94 | 60.89 |
SMA (simple moving average) of Dj Us IHI
| SMA period | SMA current | SMA prev | SMA prev2 | | 5 day SMA | 61.05 | 60.44 | 59.86 | | 12 day SMA | 60.23 | 60.05 | 59.83 | | 20 day SMA | 60.06 | 59.98 | 59.89 | | 35 day SMA | 60.57 | 60.57 | 60.57 | | 50 day SMA | 61 | 60.98 | 60.97 | | 100 day SMA | 61.11 | 61.1 | 61.09 | | 150 day SMA | 60.49 | 60.47 | 60.45 | | 200 day SMA | 61.03 | 61.01 | 60.99 |
|
|
