LongTerm IGLB full analysis,charts,indicators,moving averages,SMA,DMA,EMA,ADX,MACD,RSILong Term IGLB WideScreen charts, DMA,SMA,EMA technical analysis, forecast prediction, by indicators ADX,MACD,RSI,CCI AMEX stock exchange
Daily price and charts and targets LongTerm Strong Daily Stock price targets for LongTerm IGLB are 52.28 and 52.46 | Daily Target 1 | 52.14 | | Daily Target 2 | 52.23 | | Daily Target 3 | 52.323333333333 | | Daily Target 4 | 52.41 | | Daily Target 5 | 52.5 |
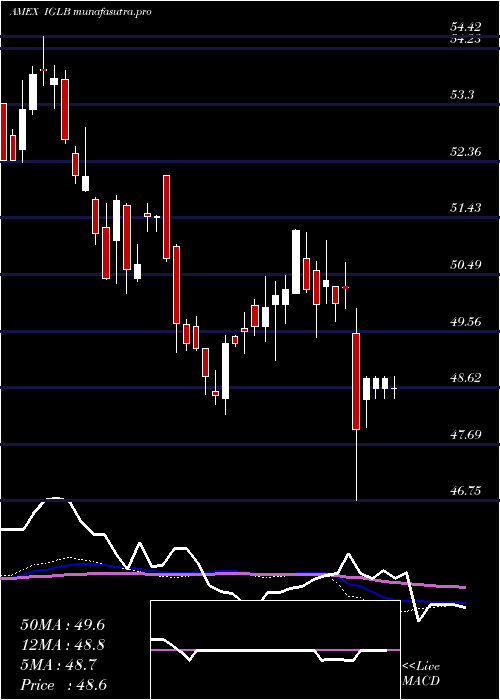
Daily price and volume Long Term
| Date |
Closing |
Open |
Range |
Volume |
Thu 23 October 2025 |
52.31 (-0.21%) |
52.29 |
52.24 - 52.42 |
0.7773 times |
Wed 22 October 2025 |
52.42 (0.13%) |
52.31 |
52.23 - 52.42 |
1.3057 times |
Tue 21 October 2025 |
52.35 (0.11%) |
52.48 |
52.33 - 52.53 |
0.6305 times |
Mon 20 October 2025 |
52.29 (0.42%) |
52.20 |
52.20 - 52.31 |
0.9571 times |
Fri 17 October 2025 |
52.07 (-0.1%) |
52.07 |
51.96 - 52.14 |
0.8557 times |
Thu 16 October 2025 |
52.12 (0.31%) |
51.94 |
51.89 - 52.17 |
1.2133 times |
Wed 15 October 2025 |
51.96 (0%) |
52.13 |
51.84 - 52.28 |
1.0276 times |
Tue 14 October 2025 |
51.96 (0.43%) |
51.58 |
51.54 - 51.98 |
1.2451 times |
Mon 13 October 2025 |
51.74 (0.43%) |
51.48 |
51.39 - 51.78 |
0.3493 times |
Fri 10 October 2025 |
51.52 (0.49%) |
51.57 |
51.41 - 51.61 |
1.6383 times |
Thu 09 October 2025 |
51.27 (-0.27%) |
51.35 |
51.22 - 51.35 |
1.9312 times |

Weekly price and charts LongTerm Strong weekly Stock price targets for LongTerm IGLB are 52.26 and 52.59 | Weekly Target 1 | 52.02 | | Weekly Target 2 | 52.16 | | Weekly Target 3 | 52.346666666667 | | Weekly Target 4 | 52.49 | | Weekly Target 5 | 52.68 |
Weekly price and volumes for Long Term
| Date |
Closing |
Open |
Range |
Volume |
Thu 23 October 2025 |
52.31 (0.46%) |
52.20 |
52.20 - 52.53 |
0.8326 times |
Fri 17 October 2025 |
52.07 (1.07%) |
51.48 |
51.39 - 52.28 |
1.0641 times |
Fri 10 October 2025 |
51.52 (-0.14%) |
51.36 |
51.22 - 51.64 |
1.1723 times |
Fri 03 October 2025 |
51.59 (0.51%) |
51.54 |
51.36 - 51.78 |
0.9894 times |
Fri 26 September 2025 |
51.33 (-0.52%) |
51.52 |
50.97 - 51.60 |
1.0541 times |
Fri 19 September 2025 |
51.60 (-0.46%) |
51.99 |
51.50 - 52.26 |
1.0843 times |
Fri 12 September 2025 |
51.84 (1.41%) |
51.38 |
51.16 - 52.06 |
0.9842 times |
Fri 05 September 2025 |
51.12 (1.97%) |
49.56 |
49.51 - 51.17 |
1.4463 times |
Fri 29 August 2025 |
50.13 (0%) |
50.27 |
50.09 - 50.28 |
0.247 times |
Fri 29 August 2025 |
50.13 (-0.77%) |
50.39 |
50.03 - 50.54 |
1.1257 times |
Fri 22 August 2025 |
50.52 (0.54%) |
50.30 |
49.90 - 50.61 |
0.5499 times |
Monthly price and charts LongTerm Strong monthly Stock price targets for LongTerm IGLB are 51.77 and 53.08 | Monthly Target 1 | 50.71 | | Monthly Target 2 | 51.51 | | Monthly Target 3 | 52.02 | | Monthly Target 4 | 52.82 | | Monthly Target 5 | 53.33 |
Monthly price and volumes Long Term
| Date |
Closing |
Open |
Range |
Volume |
Thu 23 October 2025 |
52.31 (1.49%) |
51.47 |
51.22 - 52.53 |
1.0443 times |
Tue 30 September 2025 |
51.54 (2.81%) |
49.56 |
49.51 - 52.26 |
1.4709 times |
Fri 29 August 2025 |
50.13 (0.44%) |
50.06 |
49.90 - 50.68 |
1.322 times |
Thu 31 July 2025 |
49.91 (-0.6%) |
50.08 |
48.61 - 50.21 |
0.8177 times |
Mon 30 June 2025 |
50.21 (2.47%) |
48.52 |
48.31 - 50.31 |
0.5225 times |
Fri 30 May 2025 |
49.00 (-0.49%) |
49.11 |
47.36 - 49.11 |
1.1194 times |
Wed 30 April 2025 |
49.24 (-1.97%) |
50.18 |
46.75 - 50.69 |
1.3423 times |
Mon 31 March 2025 |
50.23 (-1.91%) |
50.76 |
49.45 - 51.18 |
0.6219 times |
Fri 28 February 2025 |
51.21 (3.18%) |
49.63 |
49.08 - 51.23 |
0.8292 times |
Fri 31 January 2025 |
49.63 (0.47%) |
49.62 |
48.17 - 50.08 |
0.9099 times |
Tue 31 December 2024 |
49.40 (-3.98%) |
52.12 |
49.20 - 52.12 |
0.5425 times |

DMA SMA EMA moving averages of Long Term IGLB
DMA (daily moving average) of Long Term IGLB
| DMA period | DMA value | | 5 day DMA | 52.29 | | 12 day DMA | 51.95 | | 20 day DMA | 51.77 | | 35 day DMA | 51.71 | | 50 day DMA | 51.27 | | 100 day DMA | 50.44 | | 150 day DMA | 49.93 | | 200 day DMA | 49.92 | EMA (exponential moving average) of Long Term IGLB
| EMA period | EMA current | EMA prev | EMA prev2 | | 5 day EMA | 52.27 | 52.25 | 52.16 | | 12 day EMA | 52.05 | 52 | 51.92 | | 20 day EMA | 51.87 | 51.82 | 51.76 | | 35 day EMA | 51.54 | 51.49 | 51.44 | | 50 day EMA | 51.3 | 51.26 | 51.21 |
SMA (simple moving average) of Long Term IGLB
| SMA period | SMA current | SMA prev | SMA prev2 | | 5 day SMA | 52.29 | 52.25 | 52.16 | | 12 day SMA | 51.95 | 51.88 | 51.79 | | 20 day SMA | 51.77 | 51.72 | 51.66 | | 35 day SMA | 51.71 | 51.66 | 51.59 | | 50 day SMA | 51.27 | 51.23 | 51.19 | | 100 day SMA | 50.44 | 50.41 | 50.37 | | 150 day SMA | 49.93 | 49.92 | 49.9 | | 200 day SMA | 49.92 | 49.9 | 49.89 |
|
|
