SP IGE full analysis,charts,indicators,moving averages,SMA,DMA,EMA,ADX,MACD,RSIS P IGE WideScreen charts, DMA,SMA,EMA technical analysis, forecast prediction, by indicators ADX,MACD,RSI,CCI AMEX stock exchange
Daily price and charts and targets SP Strong Daily Stock price targets for SP IGE are 48.13 and 48.54 | Daily Target 1 | 48.04 | | Daily Target 2 | 48.22 | | Daily Target 3 | 48.446666666667 | | Daily Target 4 | 48.63 | | Daily Target 5 | 48.86 |
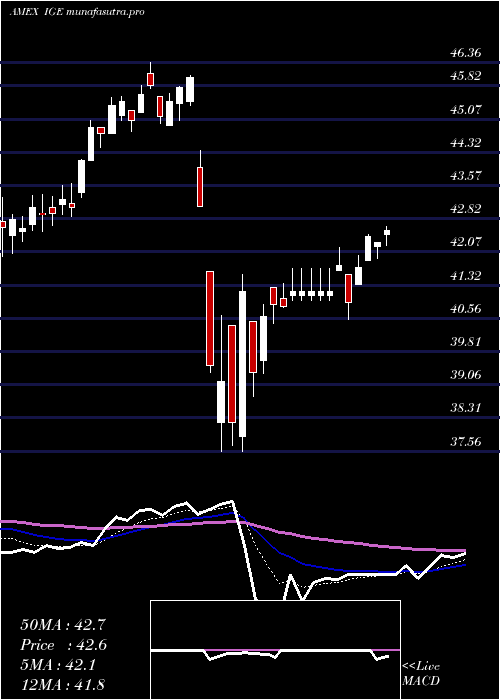
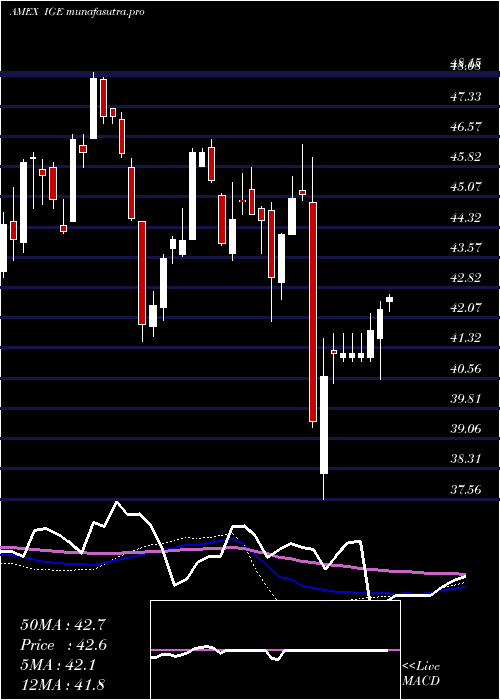
Daily price and volume S P
| Date |
Closing |
Open |
Range |
Volume |
Thu 23 October 2025 |
48.41 (1.3%) |
48.49 |
48.26 - 48.67 |
1.0483 times |
Wed 22 October 2025 |
47.79 (0.82%) |
47.29 |
47.19 - 47.96 |
1.2803 times |
Tue 21 October 2025 |
47.40 (-1.86%) |
47.82 |
47.27 - 47.82 |
0.8261 times |
Mon 20 October 2025 |
48.30 (1.24%) |
48.07 |
48.07 - 48.33 |
0.6528 times |
Fri 17 October 2025 |
47.71 (-1.12%) |
48.12 |
47.45 - 48.12 |
1.2621 times |
Thu 16 October 2025 |
48.25 (-0.39%) |
48.59 |
48.01 - 48.83 |
0.8815 times |
Wed 15 October 2025 |
48.44 (0.44%) |
48.65 |
48.09 - 48.84 |
0.8695 times |
Tue 14 October 2025 |
48.23 (-0.12%) |
47.69 |
47.58 - 48.51 |
1.0405 times |
Mon 13 October 2025 |
48.29 (-1.67%) |
47.97 |
47.93 - 48.34 |
0.9899 times |
Tue 07 October 2025 |
49.11 (-0.3%) |
49.31 |
48.75 - 49.40 |
1.1489 times |
Mon 06 October 2025 |
49.26 (0.39%) |
49.32 |
49.25 - 49.51 |
0.7504 times |
Weekly price and charts SP Strong weekly Stock price targets for SP IGE are 47.8 and 49.28 | Weekly Target 1 | 46.61 | | Weekly Target 2 | 47.51 | | Weekly Target 3 | 48.09 | | Weekly Target 4 | 48.99 | | Weekly Target 5 | 49.57 |
Weekly price and volumes for S P
| Date |
Closing |
Open |
Range |
Volume |
Thu 23 October 2025 |
48.41 (1.47%) |
48.07 |
47.19 - 48.67 |
0.4954 times |
Fri 17 October 2025 |
47.71 (-2.85%) |
47.97 |
47.45 - 48.84 |
0.6562 times |
Tue 07 October 2025 |
49.11 (0.08%) |
49.32 |
48.75 - 49.51 |
0.2471 times |
Fri 03 October 2025 |
49.07 (-1.07%) |
49.75 |
48.63 - 49.75 |
1.0447 times |
Fri 26 September 2025 |
49.60 (2.99%) |
48.18 |
47.98 - 49.88 |
1.2501 times |
Fri 19 September 2025 |
48.16 (0.08%) |
48.21 |
47.83 - 48.71 |
1.0223 times |
Fri 12 September 2025 |
48.12 (1.56%) |
47.60 |
47.05 - 48.64 |
0.9148 times |
Fri 05 September 2025 |
47.38 (-1.27%) |
47.92 |
47.08 - 48.21 |
1.6785 times |
Fri 29 August 2025 |
47.99 (0%) |
47.67 |
47.67 - 48.07 |
0.3303 times |
Fri 29 August 2025 |
47.99 (2.3%) |
46.88 |
46.74 - 48.07 |
2.3607 times |
Fri 22 August 2025 |
46.91 (2.78%) |
45.63 |
45.07 - 47.00 |
1.9248 times |
Monthly price and charts SP Strong monthly Stock price targets for SP IGE are 46.64 and 48.96 | Monthly Target 1 | 46.05 | | Monthly Target 2 | 47.23 | | Monthly Target 3 | 48.37 | | Monthly Target 4 | 49.55 | | Monthly Target 5 | 50.69 |
Monthly price and volumes S P
| Date |
Closing |
Open |
Range |
Volume |
Thu 23 October 2025 |
48.41 (-1.3%) |
48.93 |
47.19 - 49.51 |
0.361 times |
Tue 30 September 2025 |
49.05 (2.21%) |
47.92 |
47.05 - 49.88 |
1.116 times |
Fri 29 August 2025 |
47.99 (6.46%) |
44.78 |
44.36 - 48.07 |
1.5911 times |
Thu 31 July 2025 |
45.08 (1.88%) |
44.40 |
44.07 - 46.07 |
1.0875 times |
Mon 30 June 2025 |
44.25 (3.65%) |
43.31 |
42.95 - 45.64 |
0.9981 times |
Fri 30 May 2025 |
42.69 (2.37%) |
41.49 |
41.49 - 43.87 |
0.9358 times |
Wed 30 April 2025 |
41.70 (-8.29%) |
45.42 |
37.56 - 46.05 |
1.3882 times |
Mon 31 March 2025 |
45.47 (2.2%) |
44.73 |
41.97 - 46.36 |
0.8968 times |
Fri 28 February 2025 |
44.49 (1.32%) |
43.66 |
43.49 - 45.81 |
0.6438 times |
Fri 31 January 2025 |
43.91 (2.76%) |
43.07 |
43.02 - 46.49 |
0.9817 times |
Tue 31 December 2024 |
42.73 (-9.2%) |
47.00 |
41.49 - 47.16 |
1.1082 times |

DMA SMA EMA moving averages of S P IGE
DMA (daily moving average) of S P IGE
| DMA period | DMA value | | 5 day DMA | 47.92 | | 12 day DMA | 48.36 | | 20 day DMA | 48.64 | | 35 day DMA | 48.36 | | 50 day DMA | 47.78 | | 100 day DMA | 46.26 | | 150 day DMA | 45.03 | | 200 day DMA | 44.89 | EMA (exponential moving average) of S P IGE
| EMA period | EMA current | EMA prev | EMA prev2 | | 5 day EMA | 48.07 | 47.9 | 47.96 | | 12 day EMA | 48.24 | 48.21 | 48.29 | | 20 day EMA | 48.28 | 48.27 | 48.32 | | 35 day EMA | 48 | 47.98 | 47.99 | | 50 day EMA | 47.58 | 47.55 | 47.54 |
SMA (simple moving average) of S P IGE
| SMA period | SMA current | SMA prev | SMA prev2 | | 5 day SMA | 47.92 | 47.89 | 48.02 | | 12 day SMA | 48.36 | 48.39 | 48.5 | | 20 day SMA | 48.64 | 48.64 | 48.66 | | 35 day SMA | 48.36 | 48.34 | 48.35 | | 50 day SMA | 47.78 | 47.72 | 47.67 | | 100 day SMA | 46.26 | 46.2 | 46.15 | | 150 day SMA | 45.03 | 45 | 44.98 | | 200 day SMA | 44.89 | 44.87 | 44.85 |
|
|
