UsInfrastructure IFRA full analysis,charts,indicators,moving averages,SMA,DMA,EMA,ADX,MACD,RSIUs Infrastructure IFRA WideScreen charts, DMA,SMA,EMA technical analysis, forecast prediction, by indicators ADX,MACD,RSI,CCI AMEX stock exchange
Daily price and charts and targets UsInfrastructure Strong Daily Stock price targets for UsInfrastructure IFRA are 53.14 and 54.08 | Daily Target 1 | 52.38 | | Daily Target 2 | 52.95 | | Daily Target 3 | 53.32 | | Daily Target 4 | 53.89 | | Daily Target 5 | 54.26 |
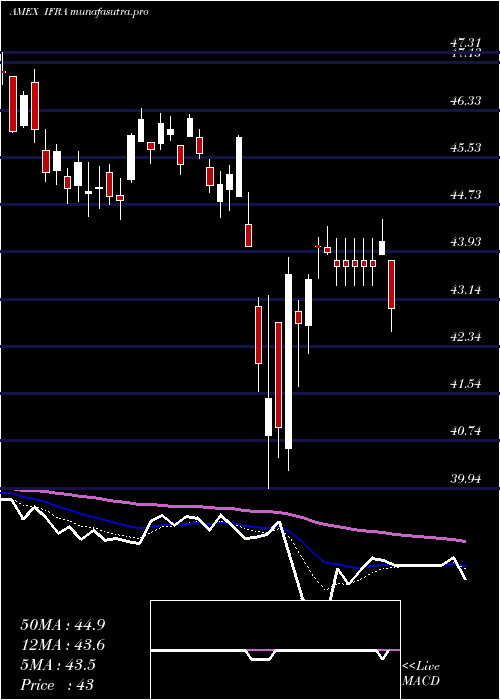
Daily price and volume Us Infrastructure
| Date |
Closing |
Open |
Range |
Volume |
Thu 23 October 2025 |
53.52 (0.89%) |
52.75 |
52.75 - 53.69 |
0.811 times |
Wed 22 October 2025 |
53.05 (-1.04%) |
53.62 |
52.80 - 53.72 |
1.5292 times |
Tue 21 October 2025 |
53.61 (-0.15%) |
53.65 |
53.21 - 53.65 |
0.958 times |
Mon 20 October 2025 |
53.69 (1.51%) |
53.37 |
53.32 - 53.74 |
0.6345 times |
Fri 17 October 2025 |
52.89 (-0.23%) |
52.95 |
52.62 - 53.07 |
0.4249 times |
Thu 16 October 2025 |
53.01 (-1.25%) |
53.85 |
52.83 - 53.85 |
1.1861 times |
Wed 15 October 2025 |
53.68 (0.62%) |
53.67 |
53.36 - 54.02 |
1.1524 times |
Tue 14 October 2025 |
53.35 (1.16%) |
52.32 |
52.32 - 53.53 |
0.8765 times |
Mon 13 October 2025 |
52.74 (1.15%) |
52.74 |
52.44 - 52.97 |
0.9991 times |
Fri 10 October 2025 |
52.14 (-1.62%) |
53.18 |
52.08 - 53.39 |
1.4282 times |
Thu 09 October 2025 |
53.00 (-1.06%) |
53.57 |
52.93 - 53.77 |
0.8276 times |
Weekly price and charts UsInfrastructure Strong weekly Stock price targets for UsInfrastructure IFRA are 53.14 and 54.13 | Weekly Target 1 | 52.35 | | Weekly Target 2 | 52.93 | | Weekly Target 3 | 53.336666666667 | | Weekly Target 4 | 53.92 | | Weekly Target 5 | 54.33 |
Weekly price and volumes for Us Infrastructure
| Date |
Closing |
Open |
Range |
Volume |
Thu 23 October 2025 |
53.52 (1.19%) |
53.37 |
52.75 - 53.74 |
0.7244 times |
Fri 17 October 2025 |
52.89 (1.44%) |
52.74 |
52.32 - 54.02 |
0.8545 times |
Fri 10 October 2025 |
52.14 (-1.59%) |
53.26 |
52.08 - 53.77 |
1.016 times |
Fri 03 October 2025 |
52.98 (1.07%) |
52.71 |
52.26 - 53.28 |
1.4944 times |
Fri 26 September 2025 |
52.42 (1%) |
51.73 |
51.57 - 52.53 |
1.0373 times |
Fri 19 September 2025 |
51.90 (-0.21%) |
52.19 |
51.28 - 52.35 |
0.9464 times |
Fri 12 September 2025 |
52.01 (-0.13%) |
52.03 |
51.04 - 52.38 |
0.8396 times |
Fri 05 September 2025 |
52.08 (0.12%) |
51.53 |
51.07 - 52.34 |
0.7216 times |
Fri 29 August 2025 |
52.02 (0%) |
52.34 |
51.87 - 52.34 |
0.2033 times |
Fri 29 August 2025 |
52.02 (-0.84%) |
52.40 |
51.87 - 52.47 |
2.1624 times |
Fri 22 August 2025 |
52.46 (2.14%) |
51.31 |
51.02 - 52.68 |
1.0112 times |

Monthly price and charts UsInfrastructure Strong monthly Stock price targets for UsInfrastructure IFRA are 52.8 and 54.74 | Monthly Target 1 | 51.27 | | Monthly Target 2 | 52.39 | | Monthly Target 3 | 53.206666666667 | | Monthly Target 4 | 54.33 | | Monthly Target 5 | 55.15 |
Monthly price and volumes Us Infrastructure
| Date |
Closing |
Open |
Range |
Volume |
Thu 23 October 2025 |
53.52 (1.33%) |
52.60 |
52.08 - 54.02 |
0.3495 times |
Tue 30 September 2025 |
52.82 (1.54%) |
51.53 |
51.04 - 52.82 |
0.5037 times |
Fri 29 August 2025 |
52.02 (2.83%) |
50.09 |
49.49 - 52.68 |
0.5882 times |
Thu 31 July 2025 |
50.59 (2.85%) |
49.01 |
49.00 - 51.69 |
0.7135 times |
Mon 30 June 2025 |
49.19 (2.97%) |
47.91 |
47.50 - 49.39 |
0.6729 times |
Fri 30 May 2025 |
47.77 (5.64%) |
45.50 |
45.23 - 48.56 |
0.4798 times |
Wed 30 April 2025 |
45.22 (0.33%) |
44.99 |
39.94 - 45.91 |
0.7135 times |
Mon 31 March 2025 |
45.07 (-3.24%) |
46.79 |
44.49 - 47.01 |
1.8132 times |
Fri 28 February 2025 |
46.58 (-1.77%) |
46.51 |
45.95 - 48.06 |
3.2639 times |
Fri 31 January 2025 |
47.42 (2.44%) |
46.66 |
45.07 - 49.32 |
0.9019 times |
Tue 31 December 2024 |
46.29 (-10.29%) |
50.49 |
45.58 - 50.54 |
0.5669 times |

DMA SMA EMA moving averages of Us Infrastructure IFRA
DMA (daily moving average) of Us Infrastructure IFRA
| DMA period | DMA value | | 5 day DMA | 53.35 | | 12 day DMA | 53.19 | | 20 day DMA | 53.01 | | 35 day DMA | 52.52 | | 50 day DMA | 52.29 | | 100 day DMA | 51.08 | | 150 day DMA | 49.21 | | 200 day DMA | 48.62 | EMA (exponential moving average) of Us Infrastructure IFRA
| EMA period | EMA current | EMA prev | EMA prev2 | | 5 day EMA | 53.35 | 53.27 | 53.38 | | 12 day EMA | 53.18 | 53.12 | 53.13 | | 20 day EMA | 52.97 | 52.91 | 52.9 | | 35 day EMA | 52.68 | 52.63 | 52.6 | | 50 day EMA | 52.33 | 52.28 | 52.25 |
SMA (simple moving average) of Us Infrastructure IFRA
| SMA period | SMA current | SMA prev | SMA prev2 | | 5 day SMA | 53.35 | 53.25 | 53.38 | | 12 day SMA | 53.19 | 53.14 | 53.14 | | 20 day SMA | 53.01 | 52.92 | 52.88 | | 35 day SMA | 52.52 | 52.47 | 52.42 | | 50 day SMA | 52.29 | 52.26 | 52.24 | | 100 day SMA | 51.08 | 51.02 | 50.97 | | 150 day SMA | 49.21 | 49.16 | 49.11 | | 200 day SMA | 48.62 | 48.59 | 48.55 |
|
|
