SP IEV full analysis,charts,indicators,moving averages,SMA,DMA,EMA,ADX,MACD,RSIS P IEV WideScreen charts, DMA,SMA,EMA technical analysis, forecast prediction, by indicators ADX,MACD,RSI,CCI AMEX stock exchange
Daily price and charts and targets SP Strong Daily Stock price targets for SP IEV are 66.54 and 66.77 | Daily Target 1 | 66.36 | | Daily Target 2 | 66.49 | | Daily Target 3 | 66.586666666667 | | Daily Target 4 | 66.72 | | Daily Target 5 | 66.82 |
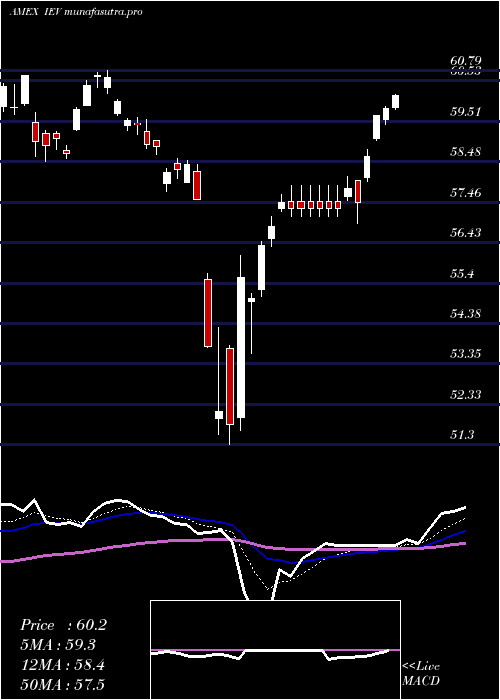
Daily price and volume S P
| Date |
Closing |
Open |
Range |
Volume |
Thu 23 October 2025 |
66.63 (0.6%) |
66.49 |
66.45 - 66.68 |
0.5417 times |
Wed 22 October 2025 |
66.23 (0%) |
66.30 |
66.02 - 66.47 |
1.1729 times |
Tue 21 October 2025 |
66.23 (-0.7%) |
66.48 |
66.23 - 66.57 |
0.5891 times |
Mon 20 October 2025 |
66.70 (0.54%) |
66.41 |
66.41 - 66.70 |
1.7604 times |
Fri 17 October 2025 |
66.34 (-0.03%) |
66.06 |
65.93 - 66.42 |
0.9362 times |
Thu 16 October 2025 |
66.36 (0.77%) |
66.32 |
66.17 - 66.59 |
0.8779 times |
Wed 15 October 2025 |
65.85 (0.14%) |
65.82 |
65.49 - 66.04 |
0.8988 times |
Tue 14 October 2025 |
65.76 (0.49%) |
64.99 |
64.98 - 65.90 |
1.0233 times |
Mon 13 October 2025 |
65.44 (-1.03%) |
65.26 |
65.09 - 65.50 |
0.6883 times |
Tue 07 October 2025 |
66.12 (-0.68%) |
66.47 |
66.12 - 66.50 |
1.5114 times |
Mon 06 October 2025 |
66.57 (-0.37%) |
66.39 |
66.39 - 66.75 |
1.102 times |
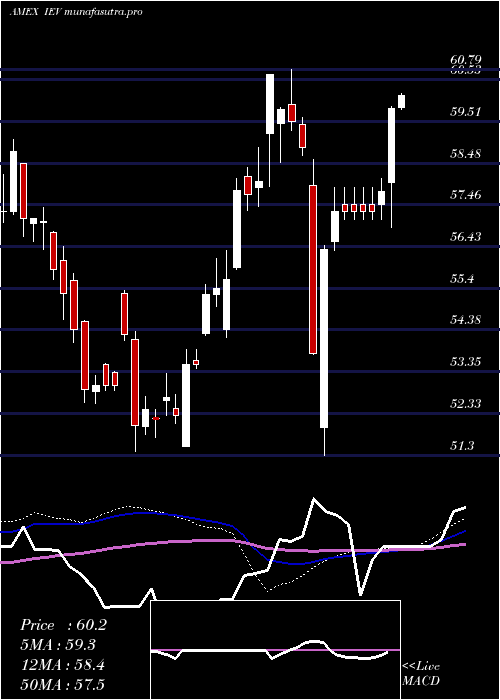
Weekly price and charts SP Strong weekly Stock price targets for SP IEV are 66.33 and 67.01 | Weekly Target 1 | 65.77 | | Weekly Target 2 | 66.2 | | Weekly Target 3 | 66.45 | | Weekly Target 4 | 66.88 | | Weekly Target 5 | 67.13 |
Weekly price and volumes for S P
| Date |
Closing |
Open |
Range |
Volume |
Thu 23 October 2025 |
66.63 (0.44%) |
66.41 |
66.02 - 66.70 |
0.6043 times |
Fri 17 October 2025 |
66.34 (0.33%) |
65.26 |
64.98 - 66.59 |
0.6579 times |
Tue 07 October 2025 |
66.12 (-1.05%) |
66.39 |
66.12 - 66.75 |
0.3886 times |
Fri 03 October 2025 |
66.82 (3.21%) |
64.97 |
64.84 - 66.93 |
0.9997 times |
Fri 26 September 2025 |
64.74 (-0.2%) |
64.90 |
63.83 - 65.43 |
1.0864 times |
Fri 19 September 2025 |
64.87 (0.14%) |
65.19 |
64.66 - 65.39 |
1.5051 times |
Fri 12 September 2025 |
64.78 (0.93%) |
64.47 |
64.25 - 65.04 |
2.07 times |
Fri 05 September 2025 |
64.18 (0.22%) |
63.03 |
62.75 - 64.57 |
1.5428 times |
Fri 29 August 2025 |
64.04 (0%) |
64.10 |
64.01 - 64.19 |
0.159 times |
Fri 29 August 2025 |
64.04 (-2.21%) |
65.16 |
63.78 - 65.29 |
0.9861 times |
Fri 22 August 2025 |
65.49 (1.5%) |
64.14 |
64.06 - 65.54 |
2.6762 times |
Monthly price and charts SP Strong monthly Stock price targets for SP IEV are 65.81 and 67.76 | Monthly Target 1 | 64.23 | | Monthly Target 2 | 65.43 | | Monthly Target 3 | 66.18 | | Monthly Target 4 | 67.38 | | Monthly Target 5 | 68.13 |
Monthly price and volumes S P
| Date |
Closing |
Open |
Range |
Volume |
Thu 23 October 2025 |
66.63 (1.76%) |
65.89 |
64.98 - 66.93 |
0.2099 times |
Tue 30 September 2025 |
65.48 (2.25%) |
63.03 |
62.75 - 65.56 |
0.7294 times |
Fri 29 August 2025 |
64.04 (3.78%) |
61.32 |
60.97 - 65.54 |
0.7872 times |
Thu 31 July 2025 |
61.71 (-2.43%) |
63.00 |
61.60 - 64.91 |
1.2304 times |
Mon 30 June 2025 |
63.25 (-0.02%) |
63.24 |
60.75 - 64.61 |
1.2105 times |
Fri 30 May 2025 |
63.26 (4.93%) |
60.41 |
59.92 - 63.75 |
1.2497 times |
Wed 30 April 2025 |
60.29 (3.59%) |
58.44 |
51.30 - 60.43 |
1.4264 times |
Mon 31 March 2025 |
58.20 (0.31%) |
59.20 |
57.72 - 60.79 |
1.4504 times |
Fri 28 February 2025 |
58.02 (4.75%) |
54.40 |
54.20 - 58.86 |
1.0197 times |
Fri 31 January 2025 |
55.39 (6.4%) |
52.14 |
51.51 - 56.14 |
0.6863 times |
Tue 31 December 2024 |
52.06 (-1.81%) |
55.28 |
51.38 - 55.34 |
0.4744 times |

DMA SMA EMA moving averages of S P IEV
DMA (daily moving average) of S P IEV
| DMA period | DMA value | | 5 day DMA | 66.43 | | 12 day DMA | 66.25 | | 20 day DMA | 65.84 | | 35 day DMA | 65.29 | | 50 day DMA | 65.03 | | 100 day DMA | 64.08 | | 150 day DMA | 62.45 | | 200 day DMA | 60.96 | EMA (exponential moving average) of S P IEV
| EMA period | EMA current | EMA prev | EMA prev2 | | 5 day EMA | 66.4 | 66.28 | 66.3 | | 12 day EMA | 66.17 | 66.09 | 66.07 | | 20 day EMA | 65.9 | 65.82 | 65.78 | | 35 day EMA | 65.44 | 65.37 | 65.32 | | 50 day EMA | 64.99 | 64.92 | 64.87 |
SMA (simple moving average) of S P IEV
| SMA period | SMA current | SMA prev | SMA prev2 | | 5 day SMA | 66.43 | 66.37 | 66.3 | | 12 day SMA | 66.25 | 66.24 | 66.24 | | 20 day SMA | 65.84 | 65.76 | 65.7 | | 35 day SMA | 65.29 | 65.22 | 65.16 | | 50 day SMA | 65.03 | 64.95 | 64.9 | | 100 day SMA | 64.08 | 64.05 | 64.02 | | 150 day SMA | 62.45 | 62.41 | 62.37 | | 200 day SMA | 60.96 | 60.89 | 60.82 |
|
|
