IndonesiaIndex IDX full analysis,charts,indicators,moving averages,SMA,DMA,EMA,ADX,MACD,RSIIndonesia Index IDX WideScreen charts, DMA,SMA,EMA technical analysis, forecast prediction, by indicators ADX,MACD,RSI,CCI AMEX stock exchange
Daily price and charts and targets IndonesiaIndex Strong Daily Stock price targets for IndonesiaIndex IDX are 16.48 and 16.57 | Daily Target 1 | 16.42 | | Daily Target 2 | 16.45 | | Daily Target 3 | 16.506666666667 | | Daily Target 4 | 16.54 | | Daily Target 5 | 16.6 |
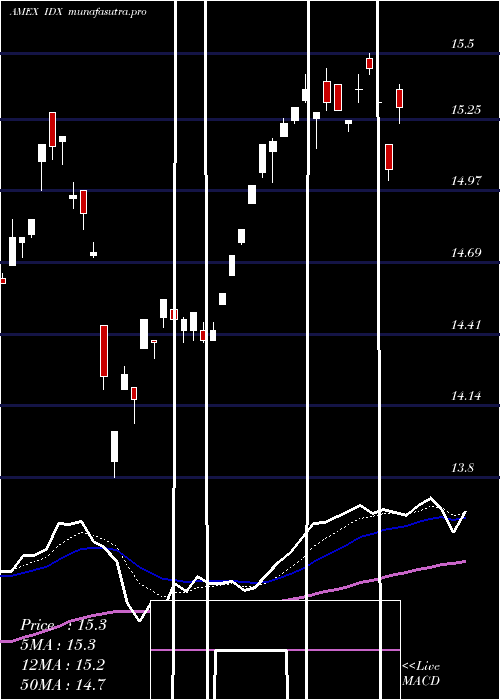
Daily price and volume Indonesia Index
| Date |
Closing |
Open |
Range |
Volume |
Thu 23 October 2025 |
16.49 (1.85%) |
16.47 |
16.47 - 16.56 |
0.2509 times |
Wed 22 October 2025 |
16.19 (-1.34%) |
16.21 |
16.17 - 16.26 |
0.4663 times |
Tue 21 October 2025 |
16.41 (0.55%) |
16.42 |
16.40 - 16.43 |
0.4052 times |
Mon 20 October 2025 |
16.32 (2.71%) |
16.23 |
16.17 - 16.32 |
0.4945 times |
Fri 17 October 2025 |
15.89 (-1.91%) |
15.84 |
15.81 - 15.91 |
3.3799 times |
Thu 16 October 2025 |
16.20 (1.06%) |
16.15 |
16.15 - 16.22 |
0.0243 times |
Wed 15 October 2025 |
16.03 (-0.31%) |
16.08 |
15.93 - 16.08 |
2.8284 times |
Tue 14 October 2025 |
16.08 (-2.01%) |
16.03 |
16.00 - 16.12 |
0.3195 times |
Mon 13 October 2025 |
16.41 (1.61%) |
16.40 |
16.40 - 16.48 |
0.3974 times |
Fri 10 October 2025 |
16.15 (-1.34%) |
16.48 |
16.10 - 16.48 |
1.4337 times |
Thu 09 October 2025 |
16.37 (0.92%) |
16.35 |
16.34 - 16.44 |
0.3428 times |
Weekly price and charts IndonesiaIndex Strong weekly Stock price targets for IndonesiaIndex IDX are 16.33 and 16.72 | Weekly Target 1 | 16.02 | | Weekly Target 2 | 16.25 | | Weekly Target 3 | 16.406666666667 | | Weekly Target 4 | 16.64 | | Weekly Target 5 | 16.8 |
Weekly price and volumes for Indonesia Index
| Date |
Closing |
Open |
Range |
Volume |
Thu 23 October 2025 |
16.49 (3.78%) |
16.23 |
16.17 - 16.56 |
0.3335 times |
Fri 17 October 2025 |
15.89 (-1.61%) |
16.40 |
15.81 - 16.48 |
1.4333 times |
Fri 10 October 2025 |
16.15 (0.12%) |
16.15 |
16.10 - 16.48 |
0.6183 times |
Fri 03 October 2025 |
16.13 (-0.06%) |
16.17 |
15.93 - 16.24 |
0.6261 times |
Fri 26 September 2025 |
16.14 (0.37%) |
16.04 |
15.69 - 16.16 |
1.3033 times |
Fri 19 September 2025 |
16.08 (0.75%) |
16.07 |
15.90 - 16.28 |
1.0911 times |
Fri 12 September 2025 |
15.96 (-0.25%) |
15.85 |
15.37 - 15.96 |
1.014 times |
Fri 05 September 2025 |
16.00 (0.69%) |
15.81 |
15.72 - 16.07 |
0.9353 times |
Fri 29 August 2025 |
15.89 (0%) |
15.81 |
15.73 - 15.91 |
0.7697 times |
Fri 29 August 2025 |
15.89 (-1.73%) |
16.25 |
15.73 - 16.27 |
1.8754 times |
Fri 22 August 2025 |
16.17 (-0.12%) |
16.24 |
15.78 - 16.37 |
1.3804 times |

Monthly price and charts IndonesiaIndex Strong monthly Stock price targets for IndonesiaIndex IDX are 16.15 and 16.9 | Monthly Target 1 | 15.54 | | Monthly Target 2 | 16.01 | | Monthly Target 3 | 16.286666666667 | | Monthly Target 4 | 16.76 | | Monthly Target 5 | 17.04 |
Monthly price and volumes Indonesia Index
| Date |
Closing |
Open |
Range |
Volume |
Thu 23 October 2025 |
16.49 (2.42%) |
15.99 |
15.81 - 16.56 |
0.3285 times |
Tue 30 September 2025 |
16.10 (1.32%) |
15.81 |
15.37 - 16.28 |
0.5817 times |
Fri 29 August 2025 |
15.89 (5.58%) |
15.36 |
15.11 - 16.52 |
0.6844 times |
Thu 31 July 2025 |
15.05 (3.44%) |
14.51 |
14.38 - 15.50 |
1.4114 times |
Mon 30 June 2025 |
14.55 (-0.68%) |
14.59 |
13.86 - 15.27 |
0.3735 times |
Fri 30 May 2025 |
14.65 (9.33%) |
13.39 |
13.37 - 14.94 |
1.5435 times |
Wed 30 April 2025 |
13.40 (7.29%) |
12.53 |
10.93 - 13.43 |
1.3302 times |
Mon 31 March 2025 |
12.49 (0%) |
13.12 |
12.00 - 13.50 |
1.899 times |
Fri 28 February 2025 |
12.49 (-14.28%) |
14.30 |
12.42 - 14.64 |
1.2335 times |
Fri 31 January 2025 |
14.57 (-1.55%) |
15.13 |
14.53 - 15.24 |
0.6142 times |
Tue 31 December 2024 |
14.80 (-8.64%) |
16.75 |
14.75 - 16.99 |
0.5971 times |

DMA SMA EMA moving averages of Indonesia Index IDX
DMA (daily moving average) of Indonesia Index IDX
| DMA period | DMA value | | 5 day DMA | 16.26 | | 12 day DMA | 16.23 | | 20 day DMA | 16.18 | | 35 day DMA | 16.07 | | 50 day DMA | 16.07 | | 100 day DMA | 15.53 | | 150 day DMA | 14.75 | | 200 day DMA | 14.54 | EMA (exponential moving average) of Indonesia Index IDX
| EMA period | EMA current | EMA prev | EMA prev2 | | 5 day EMA | 16.31 | 16.22 | 16.24 | | 12 day EMA | 16.23 | 16.18 | 16.18 | | 20 day EMA | 16.19 | 16.16 | 16.16 | | 35 day EMA | 16.16 | 16.14 | 16.14 | | 50 day EMA | 16.09 | 16.07 | 16.07 |
SMA (simple moving average) of Indonesia Index IDX
| SMA period | SMA current | SMA prev | SMA prev2 | | 5 day SMA | 16.26 | 16.2 | 16.17 | | 12 day SMA | 16.23 | 16.2 | 16.2 | | 20 day SMA | 16.18 | 16.15 | 16.14 | | 35 day SMA | 16.07 | 16.05 | 16.05 | | 50 day SMA | 16.07 | 16.07 | 16.08 | | 100 day SMA | 15.53 | 15.51 | 15.5 | | 150 day SMA | 14.75 | 14.72 | 14.7 | | 200 day SMA | 14.54 | 14.53 | 14.52 |
|
|
