SpdrIntl IBND full analysis,charts,indicators,moving averages,SMA,DMA,EMA,ADX,MACD,RSISpdr Intl IBND WideScreen charts, DMA,SMA,EMA technical analysis, forecast prediction, by indicators ADX,MACD,RSI,CCI AMEX stock exchange
Daily price and charts and targets SpdrIntl Strong Daily Stock price targets for SpdrIntl IBND are 32 and 32.11 | Daily Target 1 | 31.97 | | Daily Target 2 | 32.02 | | Daily Target 3 | 32.083333333333 | | Daily Target 4 | 32.13 | | Daily Target 5 | 32.19 |
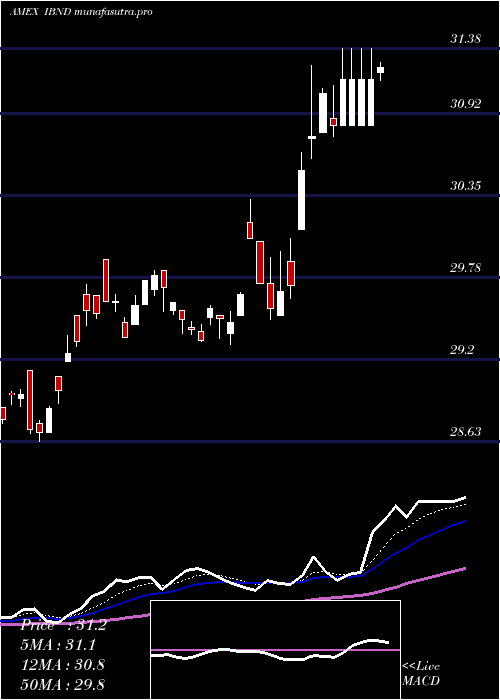
Daily price and volume Spdr Intl
| Date |
Closing |
Open |
Range |
Volume |
Thu 23 October 2025 |
32.06 (-0.03%) |
32.13 |
32.04 - 32.15 |
0.2048 times |
Wed 22 October 2025 |
32.07 (0%) |
31.92 |
31.92 - 32.12 |
0.1721 times |
Tue 21 October 2025 |
32.07 (-0.25%) |
32.06 |
31.84 - 32.15 |
1.3775 times |
Mon 20 October 2025 |
32.15 (-0.16%) |
32.25 |
32.12 - 32.35 |
0.7774 times |
Fri 17 October 2025 |
32.20 (-0.31%) |
32.25 |
32.16 - 32.30 |
2.4616 times |
Thu 16 October 2025 |
32.30 (0.59%) |
32.18 |
32.18 - 32.34 |
2.9928 times |
Wed 15 October 2025 |
32.11 (0.41%) |
32.09 |
32.09 - 32.16 |
0.9507 times |
Tue 14 October 2025 |
31.98 (0.31%) |
31.62 |
31.58 - 32.16 |
0.5596 times |
Mon 13 October 2025 |
31.88 (-0.25%) |
31.96 |
31.81 - 31.97 |
0.2067 times |
Fri 10 October 2025 |
31.96 (0.47%) |
31.80 |
31.74 - 31.98 |
0.2967 times |
Thu 09 October 2025 |
31.81 (-0.59%) |
32.00 |
31.69 - 32.01 |
0.348 times |
Weekly price and charts SpdrIntl Strong weekly Stock price targets for SpdrIntl IBND are 31.7 and 32.21 | Weekly Target 1 | 31.57 | | Weekly Target 2 | 31.82 | | Weekly Target 3 | 32.083333333333 | | Weekly Target 4 | 32.33 | | Weekly Target 5 | 32.59 |
Weekly price and volumes for Spdr Intl
| Date |
Closing |
Open |
Range |
Volume |
Thu 23 October 2025 |
32.06 (-0.43%) |
32.25 |
31.84 - 32.35 |
0.8569 times |
Fri 17 October 2025 |
32.20 (0.75%) |
31.96 |
31.58 - 32.34 |
2.4272 times |
Fri 10 October 2025 |
31.96 (-1.02%) |
32.29 |
31.69 - 32.34 |
0.6443 times |
Fri 03 October 2025 |
32.29 (0.44%) |
32.26 |
32.09 - 32.35 |
0.6994 times |
Fri 26 September 2025 |
32.15 (-0.5%) |
32.27 |
31.94 - 32.53 |
0.9104 times |
Fri 19 September 2025 |
32.31 (-0.06%) |
32.44 |
32.03 - 32.89 |
1.1134 times |
Fri 12 September 2025 |
32.33 (0.15%) |
32.55 |
32.17 - 32.58 |
0.9534 times |
Fri 05 September 2025 |
32.28 (0.31%) |
31.87 |
31.74 - 32.42 |
1.3242 times |
Fri 29 August 2025 |
32.18 (0%) |
32.03 |
32.00 - 32.28 |
0.2975 times |
Fri 29 August 2025 |
32.18 (-0.12%) |
32.21 |
31.82 - 32.28 |
0.7734 times |
Fri 22 August 2025 |
32.22 (0.22%) |
32.08 |
31.77 - 32.29 |
0.3929 times |

Monthly price and charts SpdrIntl Strong monthly Stock price targets for SpdrIntl IBND are 31.44 and 32.21 | Monthly Target 1 | 31.23 | | Monthly Target 2 | 31.64 | | Monthly Target 3 | 31.996666666667 | | Monthly Target 4 | 32.41 | | Monthly Target 5 | 32.77 |
Monthly price and volumes Spdr Intl
| Date |
Closing |
Open |
Range |
Volume |
Thu 23 October 2025 |
32.06 (-0.71%) |
32.09 |
31.58 - 32.35 |
1.1239 times |
Tue 30 September 2025 |
32.29 (0.34%) |
31.87 |
31.74 - 32.89 |
1.1631 times |
Fri 29 August 2025 |
32.18 (2.06%) |
31.79 |
31.65 - 32.34 |
1.2217 times |
Thu 31 July 2025 |
31.53 (-3.25%) |
32.41 |
31.43 - 32.66 |
1.0534 times |
Mon 30 June 2025 |
32.59 (3.82%) |
31.33 |
31.29 - 32.67 |
1.1603 times |
Fri 30 May 2025 |
31.39 (0.64%) |
31.36 |
30.30 - 31.51 |
1.8383 times |
Wed 30 April 2025 |
31.19 (5.76%) |
29.39 |
29.31 - 31.65 |
0.8634 times |
Mon 31 March 2025 |
29.49 (2.75%) |
28.70 |
28.70 - 29.90 |
0.4357 times |
Fri 28 February 2025 |
28.70 (0.6%) |
28.26 |
27.97 - 29.13 |
0.8484 times |
Fri 31 January 2025 |
28.53 (0.6%) |
28.46 |
27.69 - 28.74 |
0.2917 times |
Tue 31 December 2024 |
28.36 (-2%) |
29.44 |
28.02 - 29.45 |
0.2549 times |

DMA SMA EMA moving averages of Spdr Intl IBND
DMA (daily moving average) of Spdr Intl IBND
| DMA period | DMA value | | 5 day DMA | 32.11 | | 12 day DMA | 32.05 | | 20 day DMA | 32.11 | | 35 day DMA | 32.23 | | 50 day DMA | 32.17 | | 100 day DMA | 32.08 | | 150 day DMA | 31.61 | | 200 day DMA | 30.89 | EMA (exponential moving average) of Spdr Intl IBND
| EMA period | EMA current | EMA prev | EMA prev2 | | 5 day EMA | 32.09 | 32.1 | 32.12 | | 12 day EMA | 32.09 | 32.1 | 32.11 | | 20 day EMA | 32.12 | 32.13 | 32.14 | | 35 day EMA | 32.14 | 32.14 | 32.14 | | 50 day EMA | 32.16 | 32.16 | 32.16 |
SMA (simple moving average) of Spdr Intl IBND
| SMA period | SMA current | SMA prev | SMA prev2 | | 5 day SMA | 32.11 | 32.16 | 32.17 | | 12 day SMA | 32.05 | 32.05 | 32.05 | | 20 day SMA | 32.11 | 32.11 | 32.12 | | 35 day SMA | 32.23 | 32.22 | 32.22 | | 50 day SMA | 32.17 | 32.17 | 32.17 | | 100 day SMA | 32.08 | 32.07 | 32.06 | | 150 day SMA | 31.61 | 31.59 | 31.58 | | 200 day SMA | 30.89 | 30.87 | 30.85 |
|
|
