InspireCorporate IBD full analysis,charts,indicators,moving averages,SMA,DMA,EMA,ADX,MACD,RSIInspire Corporate IBD WideScreen charts, DMA,SMA,EMA technical analysis, forecast prediction, by indicators ADX,MACD,RSI,CCI AMEX stock exchange
Daily price and charts and targets InspireCorporate Strong Daily Stock price targets for InspireCorporate IBD are 24.29 and 24.42 | Daily Target 1 | 24.18 | | Daily Target 2 | 24.26 | | Daily Target 3 | 24.313333333333 | | Daily Target 4 | 24.39 | | Daily Target 5 | 24.44 |
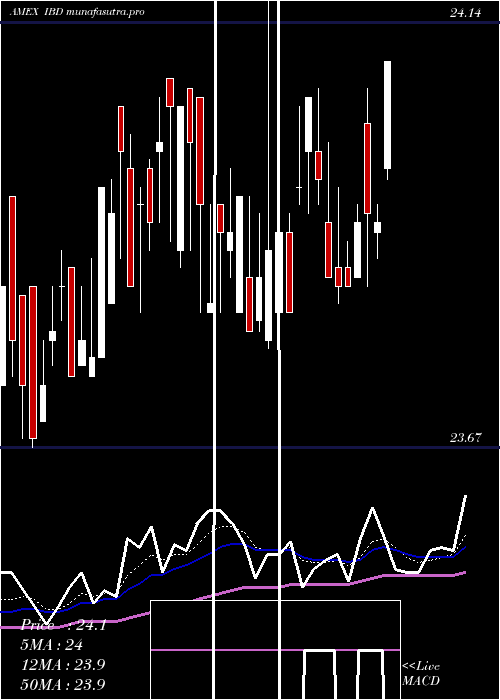
Daily price and volume Inspire Corporate
| Date |
Closing |
Open |
Range |
Volume |
Fri 24 October 2025 |
24.33 (-0.12%) |
24.24 |
24.24 - 24.37 |
0.5962 times |
Thu 23 October 2025 |
24.36 (0.12%) |
24.19 |
24.19 - 24.36 |
0.7776 times |
Wed 22 October 2025 |
24.33 (0.16%) |
24.27 |
24.27 - 24.34 |
1.2822 times |
Tue 21 October 2025 |
24.29 (-0.04%) |
24.22 |
24.22 - 24.37 |
2.3451 times |
Mon 20 October 2025 |
24.30 (-0.12%) |
24.34 |
24.27 - 24.34 |
0.8238 times |
Fri 17 October 2025 |
24.33 (0.08%) |
24.36 |
24.27 - 24.36 |
1.1944 times |
Thu 16 October 2025 |
24.31 (-0.04%) |
24.32 |
24.22 - 24.34 |
0.8964 times |
Wed 15 October 2025 |
24.32 (0%) |
24.24 |
24.24 - 24.34 |
0.5742 times |
Tue 14 October 2025 |
24.32 (-0.04%) |
24.12 |
24.12 - 24.32 |
0.4844 times |
Mon 13 October 2025 |
24.33 (0.66%) |
24.17 |
24.14 - 24.33 |
1.0257 times |
Tue 07 October 2025 |
24.17 (-0.12%) |
24.24 |
24.13 - 24.24 |
2.3012 times |
Weekly price and charts InspireCorporate Strong weekly Stock price targets for InspireCorporate IBD are 24.17 and 24.35 | Weekly Target 1 | 24.12 | | Weekly Target 2 | 24.22 | | Weekly Target 3 | 24.296666666667 | | Weekly Target 4 | 24.4 | | Weekly Target 5 | 24.48 |
Weekly price and volumes for Inspire Corporate
| Date |
Closing |
Open |
Range |
Volume |
Fri 24 October 2025 |
24.33 (0%) |
24.34 |
24.19 - 24.37 |
1.0231 times |
Fri 17 October 2025 |
24.33 (0.66%) |
24.17 |
24.12 - 24.36 |
0.7333 times |
Tue 07 October 2025 |
24.17 (0%) |
24.19 |
24.13 - 24.24 |
0.5811 times |
Fri 03 October 2025 |
24.17 (0.21%) |
24.15 |
24.09 - 24.24 |
1.0677 times |
Fri 26 September 2025 |
24.12 (-0.58%) |
24.24 |
24.05 - 24.30 |
1.5598 times |
Fri 19 September 2025 |
24.26 (-0.04%) |
24.22 |
24.18 - 24.32 |
0.8469 times |
Fri 12 September 2025 |
24.27 (0.17%) |
24.16 |
24.15 - 24.66 |
0.7672 times |
Fri 05 September 2025 |
24.23 (0.46%) |
24.26 |
23.98 - 24.26 |
1.0582 times |
Fri 29 August 2025 |
24.12 (0%) |
24.09 |
24.01 - 24.12 |
0.3118 times |
Fri 29 August 2025 |
24.12 (0.08%) |
24.16 |
24.01 - 24.76 |
2.0507 times |
Fri 22 August 2025 |
24.10 (0.17%) |
24.00 |
24.00 - 24.20 |
0.9909 times |
Monthly price and charts InspireCorporate Strong monthly Stock price targets for InspireCorporate IBD are 24.21 and 24.49 | Monthly Target 1 | 23.98 | | Monthly Target 2 | 24.16 | | Monthly Target 3 | 24.263333333333 | | Monthly Target 4 | 24.44 | | Monthly Target 5 | 24.54 |
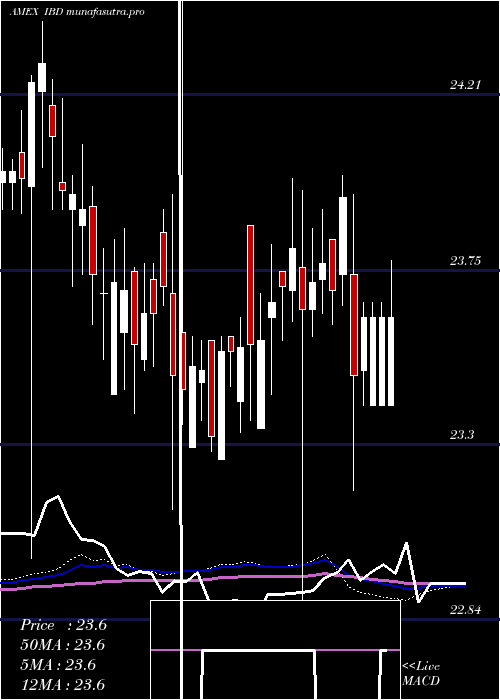
Monthly price and volumes Inspire Corporate
| Date |
Closing |
Open |
Range |
Volume |
Fri 24 October 2025 |
24.33 (0.75%) |
24.17 |
24.09 - 24.37 |
0.466 times |
Tue 30 September 2025 |
24.15 (0.12%) |
24.26 |
23.98 - 24.66 |
0.6578 times |
Fri 29 August 2025 |
24.12 (0.84%) |
23.98 |
23.92 - 24.85 |
0.8832 times |
Thu 31 July 2025 |
23.92 (-0.37%) |
24.08 |
23.78 - 24.85 |
1.0341 times |
Mon 30 June 2025 |
24.01 (1.14%) |
23.81 |
23.67 - 24.06 |
0.9769 times |
Fri 30 May 2025 |
23.74 (-0.42%) |
23.88 |
23.48 - 23.89 |
1.0598 times |
Wed 30 April 2025 |
23.84 (0.38%) |
23.85 |
23.18 - 24.00 |
1.302 times |
Mon 31 March 2025 |
23.75 (-0.25%) |
23.76 |
22.84 - 23.96 |
0.6341 times |
Fri 28 February 2025 |
23.81 (1.06%) |
23.34 |
23.34 - 23.99 |
2.2515 times |
Fri 31 January 2025 |
23.56 (0.51%) |
23.57 |
23.26 - 23.87 |
0.7347 times |
Tue 31 December 2024 |
23.44 (-0.85%) |
23.85 |
23.13 - 24.49 |
0.3662 times |

DMA SMA EMA moving averages of Inspire Corporate IBD
DMA (daily moving average) of Inspire Corporate IBD
| DMA period | DMA value | | 5 day DMA | 24.32 | | 12 day DMA | 24.3 | | 20 day DMA | 24.25 | | 35 day DMA | 24.24 | | 50 day DMA | 24.2 | | 100 day DMA | 24.05 | | 150 day DMA | 23.92 | | 200 day DMA | 23.84 | EMA (exponential moving average) of Inspire Corporate IBD
| EMA period | EMA current | EMA prev | EMA prev2 | | 5 day EMA | 24.33 | 24.33 | 24.31 | | 12 day EMA | 24.3 | 24.29 | 24.28 | | 20 day EMA | 24.28 | 24.27 | 24.26 | | 35 day EMA | 24.25 | 24.24 | 24.23 | | 50 day EMA | 24.21 | 24.2 | 24.19 |
SMA (simple moving average) of Inspire Corporate IBD
| SMA period | SMA current | SMA prev | SMA prev2 | | 5 day SMA | 24.32 | 24.32 | 24.31 | | 12 day SMA | 24.3 | 24.29 | 24.28 | | 20 day SMA | 24.25 | 24.25 | 24.24 | | 35 day SMA | 24.24 | 24.24 | 24.23 | | 50 day SMA | 24.2 | 24.19 | 24.18 | | 100 day SMA | 24.05 | 24.04 | 24.03 | | 150 day SMA | 23.92 | 23.92 | 23.91 | | 200 day SMA | 23.84 | 23.84 | 23.83 |
|
|
