DjUs IAT full analysis,charts,indicators,moving averages,SMA,DMA,EMA,ADX,MACD,RSIDj Us IAT WideScreen charts, DMA,SMA,EMA technical analysis, forecast prediction, by indicators ADX,MACD,RSI,CCI AMEX stock exchange
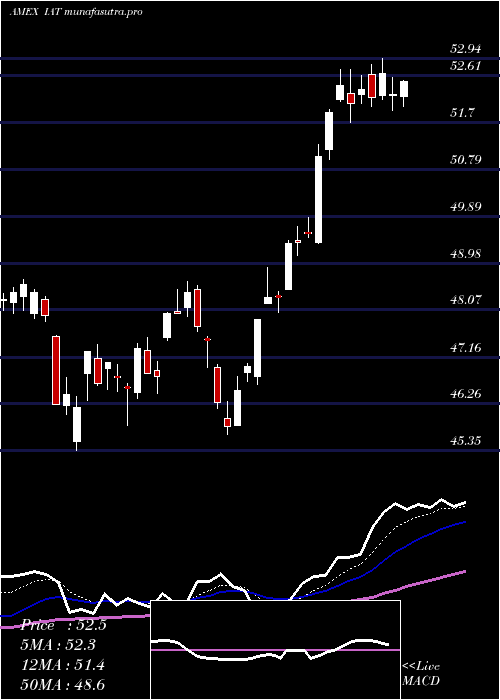
Daily price and charts and targets DjUs Strong Daily Stock price targets for DjUs IAT are 49.13 and 49.64 | Daily Target 1 | 49 | | Daily Target 2 | 49.26 | | Daily Target 3 | 49.506666666667 | | Daily Target 4 | 49.77 | | Daily Target 5 | 50.02 |
Daily price and volume Dj Us
| Date |
Closing |
Open |
Range |
Volume |
Thu 23 October 2025 |
49.53 (0.14%) |
49.67 |
49.24 - 49.75 |
0.4502 times |
Wed 22 October 2025 |
49.46 (-0.46%) |
49.74 |
49.27 - 50.01 |
0.5949 times |
Tue 21 October 2025 |
49.69 (0.51%) |
49.44 |
49.29 - 49.94 |
0.7858 times |
Mon 20 October 2025 |
49.44 (2.09%) |
48.71 |
48.69 - 49.55 |
0.7384 times |
Fri 17 October 2025 |
48.43 (1.55%) |
47.99 |
47.34 - 48.59 |
1.495 times |
Thu 16 October 2025 |
47.69 (-4.85%) |
49.94 |
47.37 - 50.04 |
1.3319 times |
Wed 15 October 2025 |
50.12 (-2.15%) |
51.23 |
49.87 - 51.36 |
1.1536 times |
Tue 14 October 2025 |
51.22 (2.56%) |
49.61 |
49.61 - 51.53 |
1.0426 times |
Mon 13 October 2025 |
49.94 (2%) |
49.69 |
49.36 - 50.10 |
0.7561 times |
Fri 10 October 2025 |
48.96 (-4.51%) |
51.45 |
48.96 - 51.55 |
1.6514 times |
Thu 09 October 2025 |
51.27 (0.08%) |
51.40 |
50.95 - 51.60 |
0.6822 times |
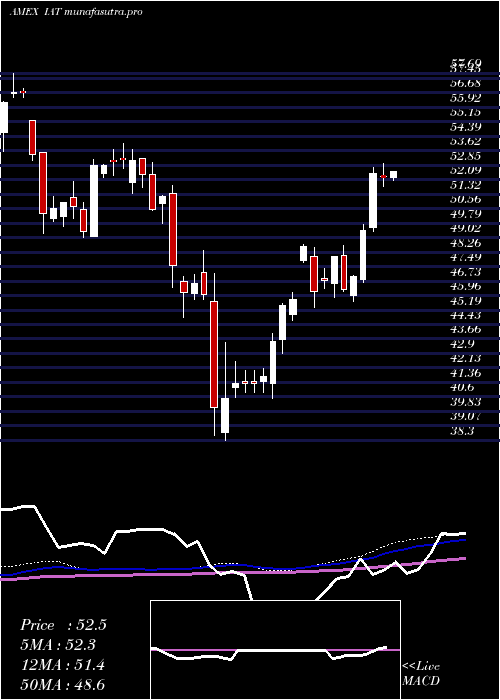
Weekly price and charts DjUs Strong weekly Stock price targets for DjUs IAT are 49.11 and 50.43 | Weekly Target 1 | 48.09 | | Weekly Target 2 | 48.81 | | Weekly Target 3 | 49.41 | | Weekly Target 4 | 50.13 | | Weekly Target 5 | 50.73 |
Weekly price and volumes for Dj Us
| Date |
Closing |
Open |
Range |
Volume |
Thu 23 October 2025 |
49.53 (2.27%) |
48.71 |
48.69 - 50.01 |
0.7661 times |
Fri 17 October 2025 |
48.43 (-1.08%) |
49.69 |
47.34 - 51.53 |
1.7231 times |
Fri 10 October 2025 |
48.96 (-6.39%) |
53.09 |
48.96 - 53.41 |
1.3484 times |
Fri 03 October 2025 |
52.30 (-1.58%) |
53.39 |
51.66 - 53.39 |
1.6953 times |
Fri 26 September 2025 |
53.14 (-1.08%) |
53.37 |
52.42 - 53.76 |
0.8065 times |
Fri 19 September 2025 |
53.72 (0.21%) |
53.69 |
51.76 - 54.06 |
0.784 times |
Fri 12 September 2025 |
53.61 (-0.33%) |
53.76 |
53.02 - 54.17 |
1.5637 times |
Fri 05 September 2025 |
53.79 (-0.59%) |
53.40 |
53.02 - 54.92 |
0.5813 times |
Fri 29 August 2025 |
54.11 (0%) |
53.99 |
53.88 - 54.38 |
0.095 times |
Fri 29 August 2025 |
54.11 (1.65%) |
53.01 |
52.82 - 54.38 |
0.6366 times |
Fri 22 August 2025 |
53.23 (4.87%) |
50.65 |
50.53 - 53.33 |
0.8842 times |
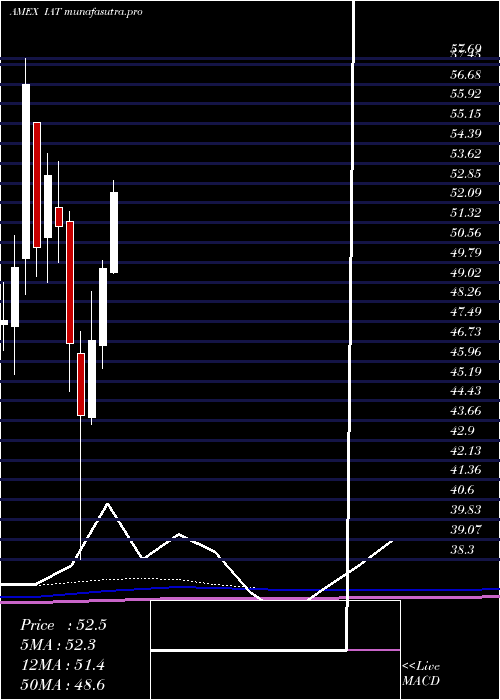
Monthly price and charts DjUs Strong monthly Stock price targets for DjUs IAT are 45.4 and 51.47 | Monthly Target 1 | 44.02 | | Monthly Target 2 | 46.78 | | Monthly Target 3 | 50.093333333333 | | Monthly Target 4 | 52.85 | | Monthly Target 5 | 56.16 |
Monthly price and volumes Dj Us
| Date |
Closing |
Open |
Range |
Volume |
Thu 23 October 2025 |
49.53 (-5.71%) |
52.22 |
47.34 - 53.41 |
1.3535 times |
Tue 30 September 2025 |
52.53 (-2.92%) |
53.40 |
51.69 - 54.92 |
1.0942 times |
Fri 29 August 2025 |
54.11 (7.9%) |
49.30 |
48.27 - 54.38 |
0.85 times |
Thu 31 July 2025 |
50.15 (1.21%) |
49.39 |
49.36 - 52.94 |
1.1059 times |
Mon 30 June 2025 |
49.55 (5.94%) |
46.58 |
45.66 - 49.87 |
0.5059 times |
Fri 30 May 2025 |
46.77 (6.66%) |
43.77 |
43.53 - 48.66 |
1.0563 times |
Wed 30 April 2025 |
43.85 (-5.96%) |
46.26 |
38.30 - 47.11 |
1.4181 times |
Mon 31 March 2025 |
46.63 (-8.91%) |
51.37 |
44.79 - 51.77 |
0.9772 times |
Fri 28 February 2025 |
51.19 (-3.67%) |
51.92 |
49.77 - 53.68 |
0.5757 times |
Fri 31 January 2025 |
53.14 (5.52%) |
50.73 |
49.02 - 54.00 |
1.0632 times |
Tue 31 December 2024 |
50.36 (-11.15%) |
55.19 |
49.25 - 55.19 |
0.7836 times |
DMA SMA EMA moving averages of Dj Us IAT
DMA (daily moving average) of Dj Us IAT
| DMA period | DMA value | | 5 day DMA | 49.31 | | 12 day DMA | 49.75 | | 20 day DMA | 50.79 | | 35 day DMA | 51.87 | | 50 day DMA | 52.18 | | 100 day DMA | 51.04 | | 150 day DMA | 48.91 | | 200 day DMA | 49.36 | EMA (exponential moving average) of Dj Us IAT
| EMA period | EMA current | EMA prev | EMA prev2 | | 5 day EMA | 49.46 | 49.43 | 49.42 | | 12 day EMA | 49.92 | 49.99 | 50.09 | | 20 day EMA | 50.5 | 50.6 | 50.72 | | 35 day EMA | 51.12 | 51.21 | 51.31 | | 50 day EMA | 51.76 | 51.85 | 51.95 |
SMA (simple moving average) of Dj Us IAT
| SMA period | SMA current | SMA prev | SMA prev2 | | 5 day SMA | 49.31 | 48.94 | 49.07 | | 12 day SMA | 49.75 | 49.94 | 50.17 | | 20 day SMA | 50.79 | 50.96 | 51.13 | | 35 day SMA | 51.87 | 52.01 | 52.14 | | 50 day SMA | 52.18 | 52.22 | 52.26 | | 100 day SMA | 51.04 | 51.01 | 50.99 | | 150 day SMA | 48.91 | 48.89 | 48.87 | | 200 day SMA | 49.36 | 49.36 | 49.37 |
|
|
