HartfordTotal HTRB full analysis,charts,indicators,moving averages,SMA,DMA,EMA,ADX,MACD,RSIHartford Total HTRB WideScreen charts, DMA,SMA,EMA technical analysis, forecast prediction, by indicators ADX,MACD,RSI,CCI AMEX stock exchange
Daily price and charts and targets HartfordTotal Strong Daily Stock price targets for HartfordTotal HTRB are 34.67 and 34.73 | Daily Target 1 | 34.65 | | Daily Target 2 | 34.68 | | Daily Target 3 | 34.713333333333 | | Daily Target 4 | 34.74 | | Daily Target 5 | 34.77 |
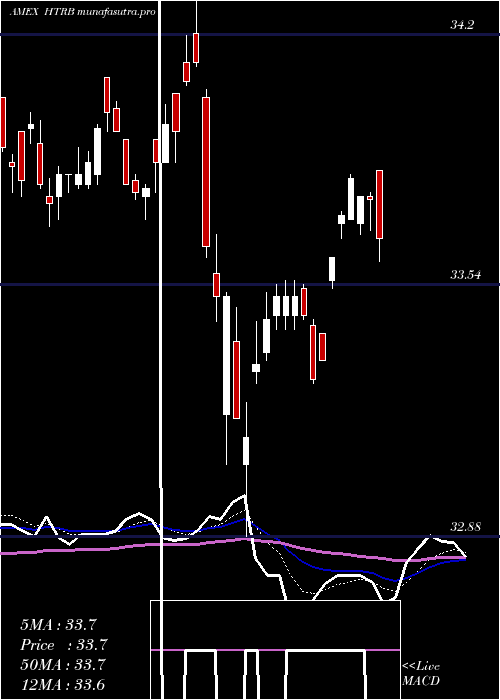
Daily price and volume Hartford Total
| Date |
Closing |
Open |
Range |
Volume |
Thu 23 October 2025 |
34.70 (-0.17%) |
34.72 |
34.69 - 34.75 |
0.8958 times |
Wed 22 October 2025 |
34.76 (0%) |
34.76 |
34.74 - 34.79 |
0.5752 times |
Tue 21 October 2025 |
34.76 (0.14%) |
34.79 |
34.75 - 34.79 |
0.7699 times |
Mon 20 October 2025 |
34.71 (0.14%) |
34.73 |
34.69 - 34.73 |
2.5961 times |
Fri 17 October 2025 |
34.66 (-0.12%) |
34.68 |
34.63 - 34.69 |
0.5482 times |
Thu 16 October 2025 |
34.70 (0.38%) |
34.56 |
34.56 - 34.71 |
1.3087 times |
Wed 15 October 2025 |
34.57 (-0.06%) |
34.64 |
34.55 - 34.65 |
0.7467 times |
Tue 14 October 2025 |
34.59 (0.2%) |
34.53 |
34.49 - 34.59 |
0.4947 times |
Mon 13 October 2025 |
34.52 (0.47%) |
34.46 |
34.45 - 34.56 |
0.6039 times |
Tue 07 October 2025 |
34.36 (0.15%) |
34.37 |
34.34 - 34.41 |
1.4609 times |
Mon 06 October 2025 |
34.31 (-0.2%) |
34.34 |
34.31 - 34.39 |
0.6155 times |
Weekly price and charts HartfordTotal Strong weekly Stock price targets for HartfordTotal HTRB are 34.65 and 34.75 | Weekly Target 1 | 34.63 | | Weekly Target 2 | 34.66 | | Weekly Target 3 | 34.726666666667 | | Weekly Target 4 | 34.76 | | Weekly Target 5 | 34.83 |
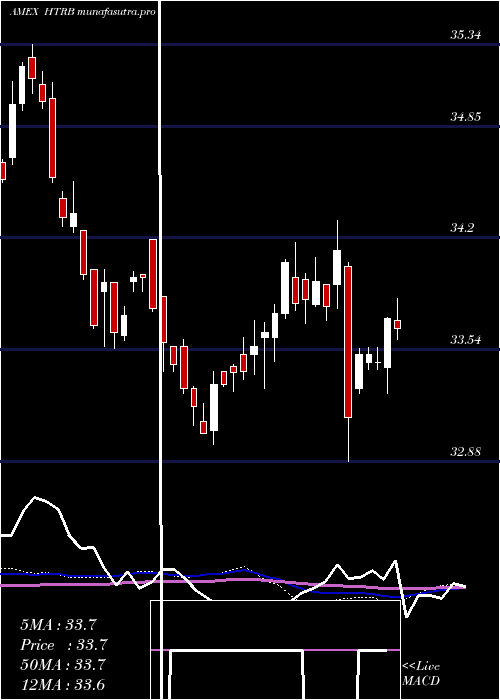
Weekly price and volumes for Hartford Total
| Date |
Closing |
Open |
Range |
Volume |
Thu 23 October 2025 |
34.70 (0.12%) |
34.73 |
34.69 - 34.79 |
1.2921 times |
Fri 17 October 2025 |
34.66 (0.87%) |
34.46 |
34.45 - 34.71 |
0.9889 times |
Tue 07 October 2025 |
34.36 (-0.06%) |
34.34 |
34.31 - 34.41 |
0.5547 times |
Fri 03 October 2025 |
34.38 (0.15%) |
34.26 |
34.26 - 34.44 |
1.0427 times |
Fri 26 September 2025 |
34.33 (-0.32%) |
34.46 |
34.28 - 34.47 |
1.5802 times |
Fri 19 September 2025 |
34.44 (-0.17%) |
34.56 |
34.39 - 34.67 |
0.8152 times |
Fri 12 September 2025 |
34.50 (0.5%) |
34.40 |
34.36 - 34.58 |
1.327 times |
Fri 05 September 2025 |
34.33 (1%) |
33.89 |
33.88 - 34.36 |
1.1888 times |
Fri 29 August 2025 |
33.99 (0%) |
34.00 |
33.97 - 34.02 |
0.2163 times |
Fri 29 August 2025 |
33.99 (-0.15%) |
34.00 |
33.96 - 34.09 |
0.9941 times |
Fri 22 August 2025 |
34.04 (0.44%) |
33.91 |
33.83 - 34.07 |
1.1424 times |
Monthly price and charts HartfordTotal Strong monthly Stock price targets for HartfordTotal HTRB are 34.51 and 34.99 | Monthly Target 1 | 34.12 | | Monthly Target 2 | 34.41 | | Monthly Target 3 | 34.6 | | Monthly Target 4 | 34.89 | | Monthly Target 5 | 35.08 |
Monthly price and volumes Hartford Total
| Date |
Closing |
Open |
Range |
Volume |
Thu 23 October 2025 |
34.70 (1.2%) |
34.40 |
34.31 - 34.79 |
0.4947 times |
Tue 30 September 2025 |
34.29 (0.88%) |
33.89 |
33.88 - 34.67 |
0.7875 times |
Fri 29 August 2025 |
33.99 (1.01%) |
33.86 |
33.83 - 34.09 |
0.6571 times |
Thu 31 July 2025 |
33.65 (-0.65%) |
33.85 |
33.43 - 33.88 |
0.8719 times |
Mon 30 June 2025 |
33.87 (1.23%) |
33.38 |
33.28 - 33.93 |
0.749 times |
Fri 30 May 2025 |
33.46 (-0.89%) |
33.84 |
33.08 - 33.84 |
1.0852 times |
Wed 30 April 2025 |
33.76 (-0.3%) |
33.86 |
32.88 - 34.30 |
1.678 times |
Mon 31 March 2025 |
33.86 (-0.56%) |
33.96 |
33.69 - 34.17 |
1.0745 times |
Fri 28 February 2025 |
34.05 (1.92%) |
33.51 |
33.31 - 34.07 |
1.2668 times |
Fri 31 January 2025 |
33.41 (0.24%) |
33.38 |
32.98 - 33.61 |
1.3353 times |
Tue 31 December 2024 |
33.33 (-1.86%) |
34.19 |
33.28 - 34.19 |
1.0086 times |

DMA SMA EMA moving averages of Hartford Total HTRB
DMA (daily moving average) of Hartford Total HTRB
| DMA period | DMA value | | 5 day DMA | 34.72 | | 12 day DMA | 34.59 | | 20 day DMA | 34.5 | | 35 day DMA | 34.45 | | 50 day DMA | 34.31 | | 100 day DMA | 33.98 | | 150 day DMA | 33.85 | | 200 day DMA | 33.77 | EMA (exponential moving average) of Hartford Total HTRB
| EMA period | EMA current | EMA prev | EMA prev2 | | 5 day EMA | 34.71 | 34.71 | 34.68 | | 12 day EMA | 34.62 | 34.6 | 34.57 | | 20 day EMA | 34.56 | 34.54 | 34.52 | | 35 day EMA | 34.43 | 34.41 | 34.39 | | 50 day EMA | 34.33 | 34.31 | 34.29 |
SMA (simple moving average) of Hartford Total HTRB
| SMA period | SMA current | SMA prev | SMA prev2 | | 5 day SMA | 34.72 | 34.72 | 34.68 | | 12 day SMA | 34.59 | 34.56 | 34.53 | | 20 day SMA | 34.5 | 34.49 | 34.47 | | 35 day SMA | 34.45 | 34.43 | 34.41 | | 50 day SMA | 34.31 | 34.29 | 34.27 | | 100 day SMA | 33.98 | 33.97 | 33.95 | | 150 day SMA | 33.85 | 33.84 | 33.83 | | 200 day SMA | 33.77 | 33.77 | 33.76 |
|
|
