HartfordMunicipal HMOP full analysis,charts,indicators,moving averages,SMA,DMA,EMA,ADX,MACD,RSIHartford Municipal HMOP WideScreen charts, DMA,SMA,EMA technical analysis, forecast prediction, by indicators ADX,MACD,RSI,CCI AMEX stock exchange
Daily price and charts and targets HartfordMunicipal Strong Daily Stock price targets for HartfordMunicipal HMOP are 39.24 and 39.4 | Daily Target 1 | 39.12 | | Daily Target 2 | 39.2 | | Daily Target 3 | 39.28 | | Daily Target 4 | 39.36 | | Daily Target 5 | 39.44 |
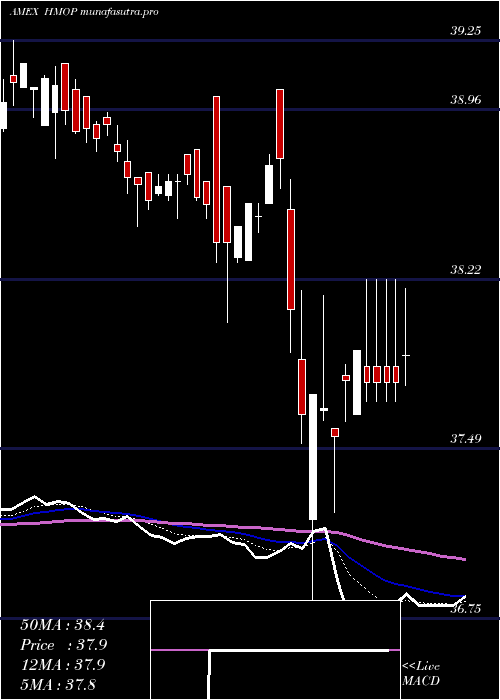
Daily price and volume Hartford Municipal
| Date |
Closing |
Open |
Range |
Volume |
Fri 24 October 2025 |
39.28 (0.05%) |
39.27 |
39.20 - 39.36 |
0.8569 times |
Thu 23 October 2025 |
39.26 (-0.03%) |
39.30 |
39.21 - 39.31 |
0.4818 times |
Wed 22 October 2025 |
39.27 (-0.1%) |
39.33 |
39.20 - 39.37 |
3.4321 times |
Tue 21 October 2025 |
39.31 (0.13%) |
39.27 |
39.17 - 39.33 |
0.5299 times |
Mon 20 October 2025 |
39.26 (0.03%) |
39.33 |
39.17 - 39.33 |
0.5291 times |
Fri 17 October 2025 |
39.25 (0.08%) |
39.27 |
39.12 - 39.28 |
0.4901 times |
Thu 16 October 2025 |
39.22 (0.23%) |
39.18 |
39.12 - 39.22 |
0.5851 times |
Wed 15 October 2025 |
39.13 (0%) |
39.19 |
39.07 - 39.19 |
1.1027 times |
Tue 14 October 2025 |
39.13 (0.08%) |
39.10 |
39.06 - 39.15 |
1.3998 times |
Mon 13 October 2025 |
39.10 (0.33%) |
39.08 |
39.01 - 39.10 |
0.5926 times |
Fri 10 October 2025 |
38.97 (-0.03%) |
39.06 |
38.97 - 39.07 |
2.0618 times |
Weekly price and charts HartfordMunicipal Strong weekly Stock price targets for HartfordMunicipal HMOP are 39.13 and 39.33 | Weekly Target 1 | 39.07 | | Weekly Target 2 | 39.18 | | Weekly Target 3 | 39.273333333333 | | Weekly Target 4 | 39.38 | | Weekly Target 5 | 39.47 |
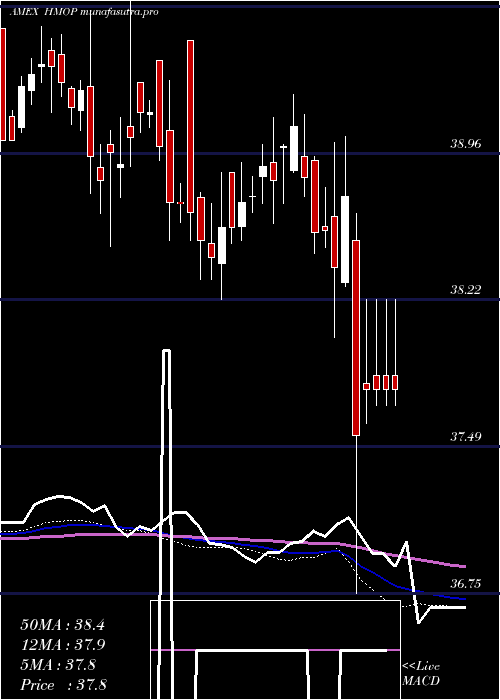
Weekly price and volumes for Hartford Municipal
| Date |
Closing |
Open |
Range |
Volume |
Fri 24 October 2025 |
39.28 (0.08%) |
39.33 |
39.17 - 39.37 |
0.9057 times |
Fri 17 October 2025 |
39.25 (0.72%) |
39.08 |
39.01 - 39.28 |
0.6479 times |
Fri 10 October 2025 |
38.97 (-0.03%) |
39.03 |
38.83 - 39.09 |
1.6177 times |
Fri 03 October 2025 |
38.98 (0.05%) |
38.96 |
38.75 - 39.01 |
0.7707 times |
Fri 26 September 2025 |
38.96 (-0.33%) |
39.12 |
38.87 - 39.12 |
0.8788 times |
Fri 19 September 2025 |
39.09 (0.1%) |
39.07 |
38.97 - 39.17 |
0.9855 times |
Fri 12 September 2025 |
39.05 (1.24%) |
38.51 |
38.51 - 39.06 |
1.5528 times |
Fri 05 September 2025 |
38.57 (0.52%) |
38.31 |
38.13 - 38.58 |
1.2274 times |
Fri 29 August 2025 |
38.37 (0%) |
38.39 |
38.22 - 38.39 |
0.1793 times |
Fri 29 August 2025 |
38.37 (0.05%) |
38.35 |
38.21 - 38.43 |
1.2343 times |
Fri 22 August 2025 |
38.35 (0.24%) |
38.27 |
38.17 - 38.37 |
1.1348 times |
Monthly price and charts HartfordMunicipal Strong monthly Stock price targets for HartfordMunicipal HMOP are 39.04 and 39.62 | Monthly Target 1 | 38.57 | | Monthly Target 2 | 38.92 | | Monthly Target 3 | 39.146666666667 | | Monthly Target 4 | 39.5 | | Monthly Target 5 | 39.73 |
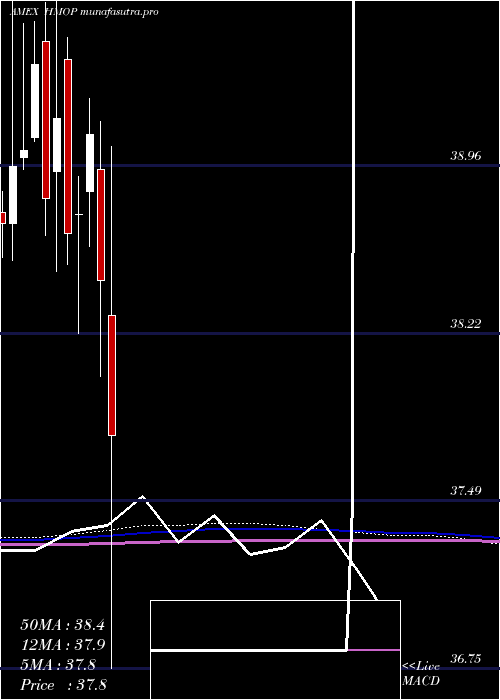
Monthly price and volumes Hartford Municipal
| Date |
Closing |
Open |
Range |
Volume |
Fri 24 October 2025 |
39.28 (0.8%) |
38.96 |
38.79 - 39.37 |
0.7639 times |
Tue 30 September 2025 |
38.97 (1.56%) |
38.31 |
38.13 - 39.17 |
0.9995 times |
Fri 29 August 2025 |
38.37 (0.66%) |
38.22 |
38.10 - 38.55 |
1.3243 times |
Thu 31 July 2025 |
38.12 (-0.42%) |
38.28 |
37.81 - 38.46 |
1.1665 times |
Mon 30 June 2025 |
38.28 (0.66%) |
38.11 |
37.80 - 38.49 |
0.9464 times |
Fri 30 May 2025 |
38.03 (-0.31%) |
38.01 |
37.66 - 38.35 |
1.11 times |
Wed 30 April 2025 |
38.15 (-0.78%) |
38.30 |
36.75 - 39.04 |
1.4301 times |
Mon 31 March 2025 |
38.45 (-1.64%) |
38.94 |
38.03 - 39.15 |
0.583 times |
Fri 28 February 2025 |
39.09 (0.9%) |
38.84 |
38.60 - 39.25 |
0.7185 times |
Fri 31 January 2025 |
38.74 (0.21%) |
38.74 |
38.22 - 38.91 |
0.9579 times |
Tue 31 December 2024 |
38.66 (-1.28%) |
39.42 |
38.52 - 39.52 |
0.5793 times |
DMA SMA EMA moving averages of Hartford Municipal HMOP
DMA (daily moving average) of Hartford Municipal HMOP
| DMA period | DMA value | | 5 day DMA | 39.28 | | 12 day DMA | 39.18 | | 20 day DMA | 39.1 | | 35 day DMA | 39.06 | | 50 day DMA | 38.85 | | 100 day DMA | 38.52 | | 150 day DMA | 38.37 | | 200 day DMA | 38.47 | EMA (exponential moving average) of Hartford Municipal HMOP
| EMA period | EMA current | EMA prev | EMA prev2 | | 5 day EMA | 39.26 | 39.25 | 39.25 | | 12 day EMA | 39.2 | 39.18 | 39.16 | | 20 day EMA | 39.13 | 39.11 | 39.09 | | 35 day EMA | 38.97 | 38.95 | 38.93 | | 50 day EMA | 38.85 | 38.83 | 38.81 |
SMA (simple moving average) of Hartford Municipal HMOP
| SMA period | SMA current | SMA prev | SMA prev2 | | 5 day SMA | 39.28 | 39.27 | 39.26 | | 12 day SMA | 39.18 | 39.15 | 39.13 | | 20 day SMA | 39.1 | 39.08 | 39.07 | | 35 day SMA | 39.06 | 39.04 | 39.01 | | 50 day SMA | 38.85 | 38.83 | 38.81 | | 100 day SMA | 38.52 | 38.5 | 38.49 | | 150 day SMA | 38.37 | 38.37 | 38.37 | | 200 day SMA | 38.47 | 38.47 | 38.46 |
|
|
