MasterIncome HIPS full analysis,charts,indicators,moving averages,SMA,DMA,EMA,ADX,MACD,RSIMaster Income HIPS WideScreen charts, DMA,SMA,EMA technical analysis, forecast prediction, by indicators ADX,MACD,RSI,CCI AMEX stock exchange
Daily price and charts and targets MasterIncome Strong Daily Stock price targets for MasterIncome HIPS are 11.67 and 11.77 | Daily Target 1 | 11.65 | | Daily Target 2 | 11.69 | | Daily Target 3 | 11.75 | | Daily Target 4 | 11.79 | | Daily Target 5 | 11.85 |
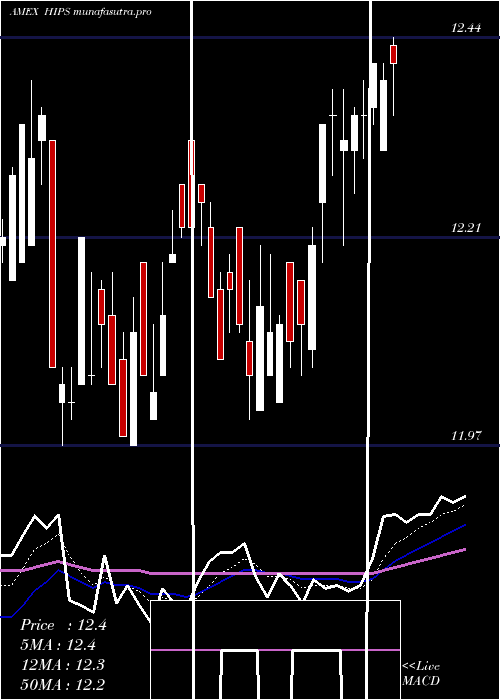
Daily price and volume Master Income
| Date |
Closing |
Open |
Range |
Volume |
Fri 24 October 2025 |
11.73 (-0.09%) |
11.74 |
11.71 - 11.81 |
0.8199 times |
Thu 23 October 2025 |
11.74 (0.17%) |
11.73 |
11.71 - 11.77 |
0.5258 times |
Wed 22 October 2025 |
11.72 (0.69%) |
11.66 |
11.66 - 11.73 |
1.816 times |
Tue 21 October 2025 |
11.64 (0.43%) |
11.57 |
11.57 - 11.68 |
1.5145 times |
Mon 20 October 2025 |
11.59 (0.87%) |
11.55 |
11.52 - 11.60 |
0.6284 times |
Fri 17 October 2025 |
11.49 (0.44%) |
11.42 |
11.42 - 11.54 |
1.052 times |
Thu 16 October 2025 |
11.44 (-1.8%) |
11.64 |
11.42 - 11.69 |
1.3582 times |
Wed 15 October 2025 |
11.65 (0.26%) |
11.64 |
11.62 - 11.72 |
0.8978 times |
Tue 14 October 2025 |
11.62 (0.52%) |
11.49 |
11.49 - 11.64 |
0.525 times |
Mon 13 October 2025 |
11.56 (-0.94%) |
11.52 |
11.51 - 11.59 |
0.8624 times |
Tue 07 October 2025 |
11.67 (-0.6%) |
11.71 |
11.67 - 11.77 |
2.7498 times |
Weekly price and charts MasterIncome Strong weekly Stock price targets for MasterIncome HIPS are 11.63 and 11.92 | Weekly Target 1 | 11.4 | | Weekly Target 2 | 11.56 | | Weekly Target 3 | 11.686666666667 | | Weekly Target 4 | 11.85 | | Weekly Target 5 | 11.98 |
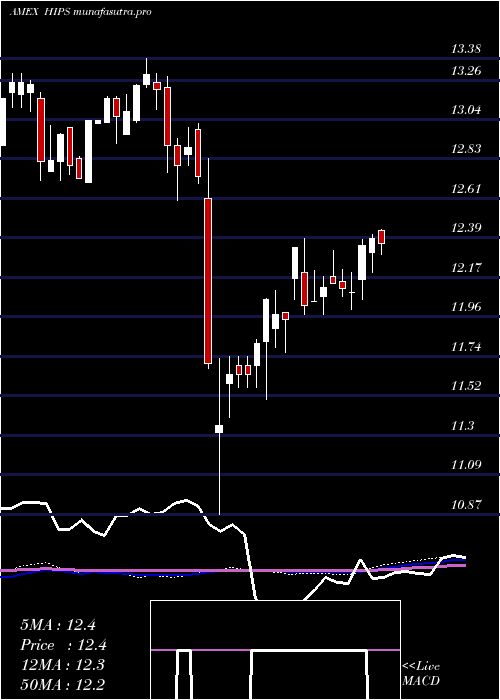
Weekly price and volumes for Master Income
| Date |
Closing |
Open |
Range |
Volume |
Fri 24 October 2025 |
11.73 (2.09%) |
11.55 |
11.52 - 11.81 |
1.0901 times |
Fri 17 October 2025 |
11.49 (-1.54%) |
11.52 |
11.42 - 11.72 |
0.9649 times |
Tue 07 October 2025 |
11.67 (-1.19%) |
11.90 |
11.67 - 11.90 |
0.9534 times |
Fri 03 October 2025 |
11.81 (-0.59%) |
11.93 |
11.77 - 11.99 |
1.4951 times |
Fri 26 September 2025 |
11.88 (-2.3%) |
12.13 |
11.87 - 12.13 |
1.1661 times |
Fri 19 September 2025 |
12.16 (-0.16%) |
12.24 |
12.10 - 12.26 |
0.9251 times |
Fri 12 September 2025 |
12.18 (-0.41%) |
12.29 |
12.15 - 12.30 |
0.4572 times |
Fri 05 September 2025 |
12.23 (0.25%) |
12.11 |
12.10 - 12.30 |
2.1331 times |
Fri 29 August 2025 |
12.20 (0%) |
12.17 |
12.12 - 12.22 |
0.167 times |
Fri 29 August 2025 |
12.20 (-0.16%) |
12.22 |
12.06 - 12.23 |
0.6481 times |
Fri 22 August 2025 |
12.22 (0.08%) |
12.22 |
12.06 - 12.27 |
1.3044 times |
Monthly price and charts MasterIncome Strong monthly Stock price targets for MasterIncome HIPS are 11.29 and 11.86 | Monthly Target 1 | 11.14 | | Monthly Target 2 | 11.44 | | Monthly Target 3 | 11.713333333333 | | Monthly Target 4 | 12.01 | | Monthly Target 5 | 12.28 |
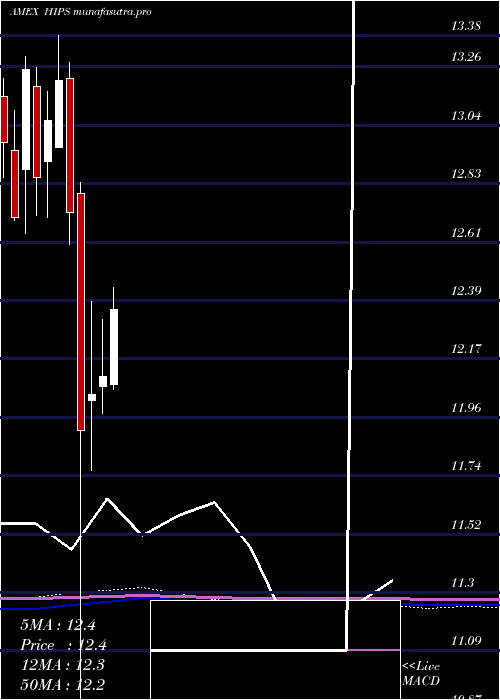
Monthly price and volumes Master Income
| Date |
Closing |
Open |
Range |
Volume |
Fri 24 October 2025 |
11.73 (-0.51%) |
11.82 |
11.42 - 11.99 |
0.8023 times |
Tue 30 September 2025 |
11.79 (-3.36%) |
12.11 |
11.77 - 12.30 |
1.312 times |
Fri 29 August 2025 |
12.20 (0.08%) |
12.12 |
12.03 - 12.30 |
1.2785 times |
Thu 31 July 2025 |
12.19 (0.66%) |
12.08 |
12.06 - 12.46 |
0.8987 times |
Mon 30 June 2025 |
12.11 (0.58%) |
12.07 |
11.97 - 12.32 |
0.6428 times |
Fri 30 May 2025 |
12.04 (1.09%) |
12.02 |
11.76 - 12.39 |
0.6623 times |
Wed 30 April 2025 |
11.91 (-6.37%) |
12.79 |
10.87 - 12.83 |
1.3917 times |
Mon 31 March 2025 |
12.72 (-3.71%) |
13.22 |
12.60 - 13.28 |
1.2453 times |
Fri 28 February 2025 |
13.21 (1.15%) |
12.96 |
12.96 - 13.38 |
1.1167 times |
Fri 31 January 2025 |
13.06 (1.63%) |
12.91 |
12.70 - 13.17 |
0.6498 times |
Tue 31 December 2024 |
12.85 (-3.02%) |
13.19 |
12.71 - 13.26 |
0.8147 times |
DMA SMA EMA moving averages of Master Income HIPS
DMA (daily moving average) of Master Income HIPS
| DMA period | DMA value | | 5 day DMA | 11.68 | | 12 day DMA | 11.63 | | 20 day DMA | 11.73 | | 35 day DMA | 11.92 | | 50 day DMA | 12 | | 100 day DMA | 12.11 | | 150 day DMA | 12.1 | | 200 day DMA | 12.33 | EMA (exponential moving average) of Master Income HIPS
| EMA period | EMA current | EMA prev | EMA prev2 | | 5 day EMA | 11.69 | 11.67 | 11.63 | | 12 day EMA | 11.7 | 11.69 | 11.68 | | 20 day EMA | 11.75 | 11.75 | 11.75 | | 35 day EMA | 11.83 | 11.84 | 11.85 | | 50 day EMA | 11.98 | 11.99 | 12 |
SMA (simple moving average) of Master Income HIPS
| SMA period | SMA current | SMA prev | SMA prev2 | | 5 day SMA | 11.68 | 11.64 | 11.58 | | 12 day SMA | 11.63 | 11.64 | 11.65 | | 20 day SMA | 11.73 | 11.74 | 11.75 | | 35 day SMA | 11.92 | 11.93 | 11.95 | | 50 day SMA | 12 | 12 | 12.01 | | 100 day SMA | 12.11 | 12.11 | 12.11 | | 150 day SMA | 12.1 | 12.11 | 12.11 | | 200 day SMA | 12.33 | 12.33 | 12.34 |
|
|
