HedgeReplication HDG full analysis,charts,indicators,moving averages,SMA,DMA,EMA,ADX,MACD,RSIHedge Replication HDG WideScreen charts, DMA,SMA,EMA technical analysis, forecast prediction, by indicators ADX,MACD,RSI,CCI AMEX stock exchange
Daily price and charts and targets HedgeReplication Strong Daily Stock price targets for HedgeReplication HDG are 51.65 and 51.67 | Daily Target 1 | 51.63 | | Daily Target 2 | 51.65 | | Daily Target 3 | 51.653333333333 | | Daily Target 4 | 51.67 | | Daily Target 5 | 51.67 |
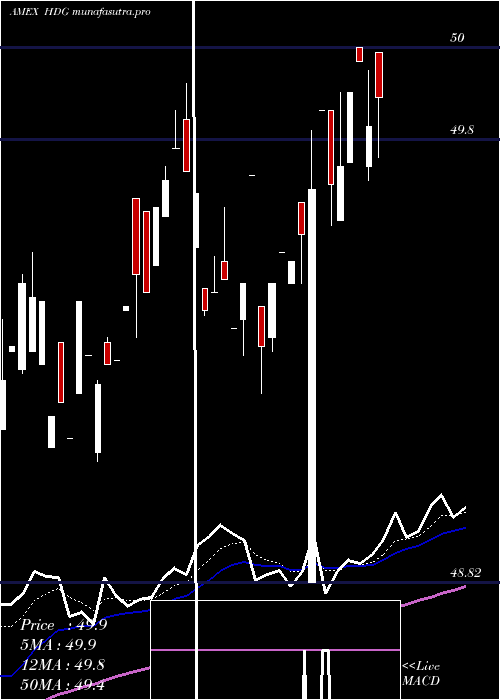
Daily price and volume Hedge Replication
| Date |
Closing |
Open |
Range |
Volume |
Thu 23 October 2025 |
51.66 (0.6%) |
51.64 |
51.64 - 51.66 |
2.1828 times |
Wed 22 October 2025 |
51.35 (-0.35%) |
51.35 |
51.35 - 51.35 |
0.6101 times |
Tue 21 October 2025 |
51.53 (-0.06%) |
51.53 |
51.53 - 51.53 |
0.9279 times |
Mon 20 October 2025 |
51.56 (0.47%) |
51.56 |
51.56 - 51.56 |
0.4802 times |
Fri 17 October 2025 |
51.32 (0.04%) |
51.34 |
51.32 - 51.35 |
1.3918 times |
Thu 16 October 2025 |
51.30 (-0.37%) |
51.30 |
51.30 - 51.30 |
0.9279 times |
Wed 15 October 2025 |
51.49 (0.29%) |
51.49 |
51.49 - 51.49 |
0.4639 times |
Tue 14 October 2025 |
51.34 (0.18%) |
51.34 |
51.34 - 51.34 |
0.232 times |
Mon 13 October 2025 |
51.25 (-0.12%) |
51.16 |
51.08 - 51.25 |
2.0877 times |
Tue 07 October 2025 |
51.31 (-0.29%) |
51.31 |
51.31 - 51.31 |
0.6959 times |
Mon 06 October 2025 |
51.46 (0.21%) |
51.49 |
51.45 - 51.57 |
3.1431 times |
Weekly price and charts HedgeReplication Strong weekly Stock price targets for HedgeReplication HDG are 51.51 and 51.82 | Weekly Target 1 | 51.25 | | Weekly Target 2 | 51.45 | | Weekly Target 3 | 51.556666666667 | | Weekly Target 4 | 51.76 | | Weekly Target 5 | 51.87 |
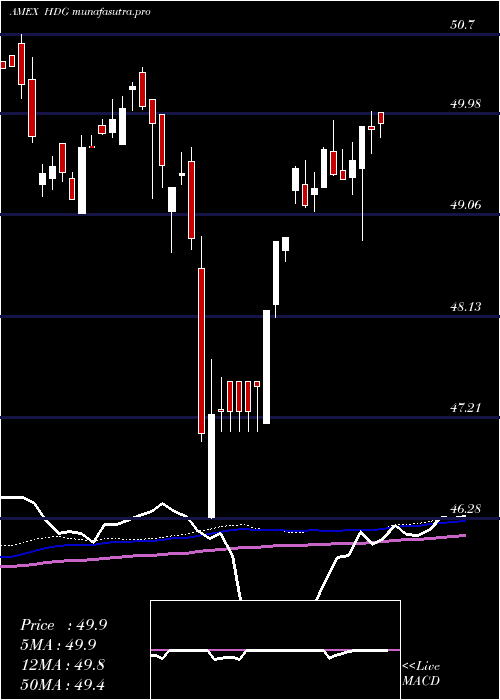
Weekly price and volumes for Hedge Replication
| Date |
Closing |
Open |
Range |
Volume |
Thu 23 October 2025 |
51.66 (0.66%) |
51.56 |
51.35 - 51.66 |
0.73 times |
Fri 17 October 2025 |
51.32 (0.02%) |
51.16 |
51.08 - 51.49 |
0.8868 times |
Tue 07 October 2025 |
51.31 (-0.08%) |
51.49 |
51.31 - 51.57 |
0.6671 times |
Fri 03 October 2025 |
51.35 (0.79%) |
51.03 |
50.96 - 51.35 |
1.025 times |
Fri 26 September 2025 |
50.95 (-0.88%) |
51.33 |
50.87 - 51.47 |
0.524 times |
Fri 19 September 2025 |
51.40 (0.49%) |
51.18 |
51.08 - 51.47 |
1.2495 times |
Fri 12 September 2025 |
51.15 (0.71%) |
49.91 |
49.91 - 51.29 |
2.1363 times |
Fri 05 September 2025 |
50.79 (0.22%) |
50.45 |
50.45 - 50.86 |
1.3302 times |
Fri 29 August 2025 |
50.68 (0%) |
50.54 |
50.54 - 50.68 |
0.2418 times |
Fri 29 August 2025 |
50.68 (-0.08%) |
50.72 |
50.54 - 50.86 |
1.2092 times |
Fri 22 August 2025 |
50.72 (0.6%) |
50.35 |
50.28 - 50.78 |
2.2572 times |
Monthly price and charts HedgeReplication Strong monthly Stock price targets for HedgeReplication HDG are 51.37 and 51.96 | Monthly Target 1 | 50.87 | | Monthly Target 2 | 51.27 | | Monthly Target 3 | 51.463333333333 | | Monthly Target 4 | 51.86 | | Monthly Target 5 | 52.05 |
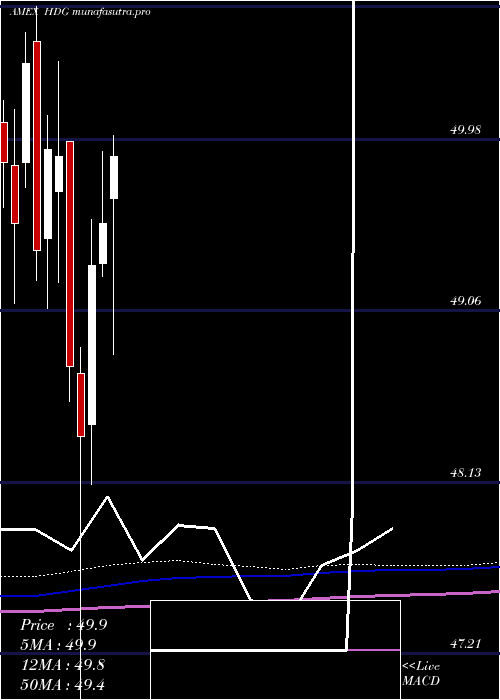
Monthly price and volumes Hedge Replication
| Date |
Closing |
Open |
Range |
Volume |
Thu 23 October 2025 |
51.66 (1.14%) |
51.16 |
51.07 - 51.66 |
0.3615 times |
Tue 30 September 2025 |
51.08 (0.79%) |
50.45 |
49.91 - 51.47 |
0.717 times |
Fri 29 August 2025 |
50.68 (1.4%) |
49.67 |
49.66 - 50.86 |
0.7119 times |
Thu 31 July 2025 |
49.98 (0.91%) |
49.66 |
48.82 - 50.29 |
0.6975 times |
Mon 30 June 2025 |
49.53 (0.47%) |
49.31 |
49.24 - 49.92 |
0.8442 times |
Fri 30 May 2025 |
49.30 (1.9%) |
48.44 |
48.12 - 49.55 |
0.9903 times |
Wed 30 April 2025 |
48.38 (-0.78%) |
48.72 |
46.28 - 48.86 |
0.7915 times |
Mon 31 March 2025 |
48.76 (-2.26%) |
49.97 |
48.57 - 49.97 |
1.3164 times |
Fri 28 February 2025 |
49.89 (-0.08%) |
49.70 |
49.21 - 50.40 |
1.2764 times |
Fri 31 January 2025 |
49.93 (1.11%) |
49.45 |
49.07 - 50.11 |
2.2932 times |
Tue 31 December 2024 |
49.38 (-2%) |
50.51 |
49.22 - 50.70 |
1.9163 times |
DMA SMA EMA moving averages of Hedge Replication HDG
DMA (daily moving average) of Hedge Replication HDG
| DMA period | DMA value | | 5 day DMA | 51.48 | | 12 day DMA | 51.41 | | 20 day DMA | 51.28 | | 35 day DMA | 51.18 | | 50 day DMA | 50.99 | | 100 day DMA | 50.37 | | 150 day DMA | 49.71 | | 200 day DMA | 49.72 | EMA (exponential moving average) of Hedge Replication HDG
| EMA period | EMA current | EMA prev | EMA prev2 | | 5 day EMA | 51.5 | 51.42 | 51.45 | | 12 day EMA | 51.41 | 51.36 | 51.36 | | 20 day EMA | 51.32 | 51.28 | 51.27 | | 35 day EMA | 51.14 | 51.11 | 51.1 | | 50 day EMA | 50.97 | 50.94 | 50.92 |
SMA (simple moving average) of Hedge Replication HDG
| SMA period | SMA current | SMA prev | SMA prev2 | | 5 day SMA | 51.48 | 51.41 | 51.44 | | 12 day SMA | 51.41 | 51.38 | 51.36 | | 20 day SMA | 51.28 | 51.27 | 51.27 | | 35 day SMA | 51.18 | 51.15 | 51.13 | | 50 day SMA | 50.99 | 50.96 | 50.93 | | 100 day SMA | 50.37 | 50.34 | 50.32 | | 150 day SMA | 49.71 | 49.7 | 49.69 | | 200 day SMA | 49.72 | 49.71 | 49.7 |
|
|
