HartfordCore HCRB full analysis,charts,indicators,moving averages,SMA,DMA,EMA,ADX,MACD,RSIHartford Core HCRB WideScreen charts, DMA,SMA,EMA technical analysis, forecast prediction, by indicators ADX,MACD,RSI,CCI AMEX stock exchange
Daily price and charts and targets HartfordCore Strong Daily Stock price targets for HartfordCore HCRB are 35.88 and 35.95 | Daily Target 1 | 35.86 | | Daily Target 2 | 35.89 | | Daily Target 3 | 35.926666666667 | | Daily Target 4 | 35.96 | | Daily Target 5 | 36 |
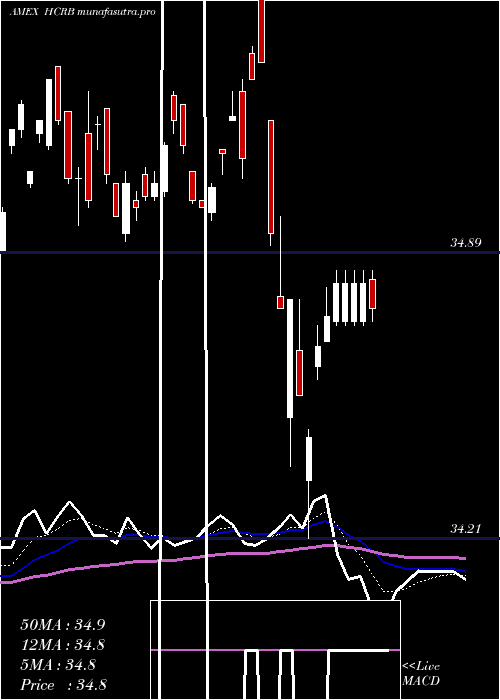
Daily price and volume Hartford Core
| Date |
Closing |
Open |
Range |
Volume |
Fri 24 October 2025 |
35.93 (0.08%) |
35.96 |
35.89 - 35.96 |
1.0642 times |
Thu 23 October 2025 |
35.90 (-0.22%) |
35.93 |
35.90 - 35.95 |
0.976 times |
Wed 22 October 2025 |
35.98 (0.03%) |
35.95 |
35.94 - 35.99 |
0.9151 times |
Tue 21 October 2025 |
35.97 (0.14%) |
36.05 |
35.96 - 36.05 |
0.8311 times |
Mon 20 October 2025 |
35.92 (0.2%) |
35.91 |
35.89 - 35.92 |
0.8382 times |
Fri 17 October 2025 |
35.85 (-0.19%) |
35.90 |
35.85 - 35.90 |
0.6012 times |
Thu 16 October 2025 |
35.92 (0.31%) |
35.80 |
35.80 - 35.93 |
0.9018 times |
Wed 15 October 2025 |
35.81 (0.03%) |
35.85 |
35.77 - 35.85 |
2.0865 times |
Tue 14 October 2025 |
35.80 (0.2%) |
35.75 |
35.71 - 35.80 |
1.4853 times |
Mon 13 October 2025 |
35.73 (0.42%) |
35.67 |
35.55 - 35.73 |
0.3006 times |
Tue 07 October 2025 |
35.58 (0.17%) |
35.56 |
35.55 - 35.63 |
5.4108 times |
Weekly price and charts HartfordCore Strong weekly Stock price targets for HartfordCore HCRB are 35.91 and 36.07 | Weekly Target 1 | 35.8 | | Weekly Target 2 | 35.86 | | Weekly Target 3 | 35.956666666667 | | Weekly Target 4 | 36.02 | | Weekly Target 5 | 36.12 |
Weekly price and volumes for Hartford Core
| Date |
Closing |
Open |
Range |
Volume |
Fri 24 October 2025 |
35.93 (0.22%) |
35.91 |
35.89 - 36.05 |
0.7509 times |
Fri 17 October 2025 |
35.85 (0.76%) |
35.67 |
35.55 - 35.93 |
0.8728 times |
Tue 07 October 2025 |
35.58 (-0.11%) |
35.56 |
35.51 - 35.63 |
1.1176 times |
Fri 03 October 2025 |
35.62 (0.2%) |
35.50 |
35.50 - 35.73 |
4.2467 times |
Fri 26 September 2025 |
35.55 (-0.28%) |
35.74 |
35.52 - 35.74 |
0.6432 times |
Fri 19 September 2025 |
35.65 (-0.17%) |
35.86 |
35.61 - 35.87 |
0.5082 times |
Fri 12 September 2025 |
35.71 (0.42%) |
35.72 |
35.59 - 35.79 |
0.4005 times |
Fri 05 September 2025 |
35.56 (0.91%) |
35.11 |
35.11 - 35.60 |
0.412 times |
Fri 29 August 2025 |
35.24 (0%) |
35.30 |
35.21 - 35.30 |
0.1608 times |
Fri 29 August 2025 |
35.24 (-0.06%) |
35.23 |
35.18 - 35.32 |
0.8872 times |
Fri 22 August 2025 |
35.26 (0.43%) |
35.16 |
35.07 - 35.28 |
0.5843 times |

Monthly price and charts HartfordCore Strong monthly Stock price targets for HartfordCore HCRB are 35.72 and 36.26 | Monthly Target 1 | 35.29 | | Monthly Target 2 | 35.61 | | Monthly Target 3 | 35.83 | | Monthly Target 4 | 36.15 | | Monthly Target 5 | 36.37 |
Monthly price and volumes Hartford Core
| Date |
Closing |
Open |
Range |
Volume |
Fri 24 October 2025 |
35.93 (1.21%) |
35.73 |
35.51 - 36.05 |
0.4437 times |
Tue 30 September 2025 |
35.50 (0.74%) |
35.11 |
35.11 - 35.87 |
0.784 times |
Fri 29 August 2025 |
35.24 (1%) |
35.10 |
35.07 - 35.32 |
0.5779 times |
Thu 31 July 2025 |
34.89 (-0.54%) |
35.11 |
34.69 - 35.12 |
0.461 times |
Mon 30 June 2025 |
35.08 (1.18%) |
34.60 |
34.50 - 35.15 |
2.759 times |
Fri 30 May 2025 |
34.67 (-1.08%) |
35.10 |
34.32 - 35.10 |
0.4677 times |
Wed 30 April 2025 |
35.05 (-0.23%) |
35.21 |
34.21 - 35.57 |
0.6593 times |
Mon 31 March 2025 |
35.13 (-0.23%) |
35.15 |
34.92 - 35.34 |
2.0078 times |
Fri 28 February 2025 |
35.21 (1.91%) |
34.79 |
34.47 - 35.26 |
0.543 times |
Fri 31 January 2025 |
34.55 (0.14%) |
34.56 |
34.09 - 34.75 |
1.2964 times |
Tue 31 December 2024 |
34.50 (-1.85%) |
35.30 |
34.50 - 35.37 |
0.5195 times |

DMA SMA EMA moving averages of Hartford Core HCRB
DMA (daily moving average) of Hartford Core HCRB
| DMA period | DMA value | | 5 day DMA | 35.94 | | 12 day DMA | 35.83 | | 20 day DMA | 35.72 | | 35 day DMA | 35.69 | | 50 day DMA | 35.54 | | 100 day DMA | 35.22 | | 150 day DMA | 35.09 | | 200 day DMA | 35 | EMA (exponential moving average) of Hartford Core HCRB
| EMA period | EMA current | EMA prev | EMA prev2 | | 5 day EMA | 35.92 | 35.91 | 35.92 | | 12 day EMA | 35.84 | 35.82 | 35.81 | | 20 day EMA | 35.78 | 35.76 | 35.75 | | 35 day EMA | 35.66 | 35.64 | 35.62 | | 50 day EMA | 35.56 | 35.54 | 35.53 |
SMA (simple moving average) of Hartford Core HCRB
| SMA period | SMA current | SMA prev | SMA prev2 | | 5 day SMA | 35.94 | 35.92 | 35.93 | | 12 day SMA | 35.83 | 35.8 | 35.78 | | 20 day SMA | 35.72 | 35.71 | 35.7 | | 35 day SMA | 35.69 | 35.67 | 35.65 | | 50 day SMA | 35.54 | 35.53 | 35.51 | | 100 day SMA | 35.22 | 35.21 | 35.2 | | 150 day SMA | 35.09 | 35.08 | 35.08 | | 200 day SMA | 35 | 34.99 | 34.99 |
|
|
