MarketVectors HAP full analysis,charts,indicators,moving averages,SMA,DMA,EMA,ADX,MACD,RSIMarket Vectors HAP WideScreen charts, DMA,SMA,EMA technical analysis, forecast prediction, by indicators ADX,MACD,RSI,CCI AMEX stock exchange
Daily price and charts and targets MarketVectors Strong Daily Stock price targets for MarketVectors HAP are 57.5 and 57.65 | Daily Target 1 | 57.47 | | Daily Target 2 | 57.52 | | Daily Target 3 | 57.616666666667 | | Daily Target 4 | 57.67 | | Daily Target 5 | 57.77 |
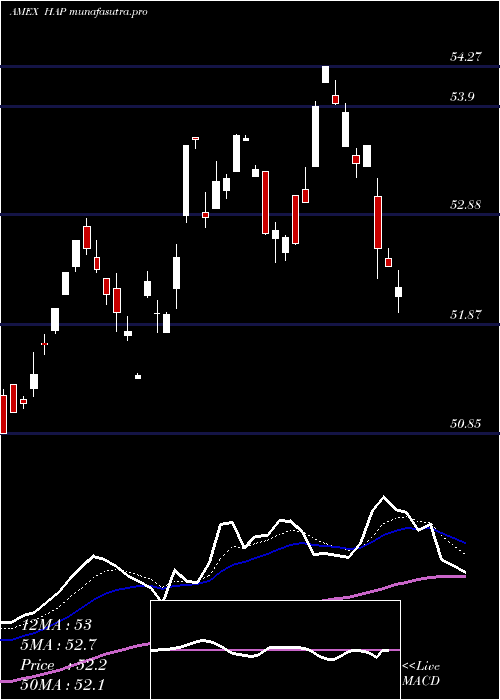
Daily price and volume Market Vectors
| Date |
Closing |
Open |
Range |
Volume |
Fri 24 October 2025 |
57.58 (0.05%) |
57.61 |
57.56 - 57.71 |
0.6403 times |
Thu 23 October 2025 |
57.55 (0.95%) |
57.59 |
57.44 - 57.71 |
0.1784 times |
Wed 22 October 2025 |
57.01 (0.62%) |
56.53 |
56.50 - 57.01 |
0.4359 times |
Tue 21 October 2025 |
56.66 (-2.14%) |
57.06 |
56.62 - 57.07 |
1.1767 times |
Mon 20 October 2025 |
57.90 (1.01%) |
57.60 |
57.60 - 57.90 |
0.2285 times |
Fri 17 October 2025 |
57.32 (-0.81%) |
57.63 |
57.13 - 57.66 |
0.5794 times |
Thu 16 October 2025 |
57.79 (0.26%) |
57.74 |
57.52 - 58.26 |
5.3797 times |
Wed 15 October 2025 |
57.64 (0.91%) |
57.68 |
57.50 - 57.87 |
0.307 times |
Tue 14 October 2025 |
57.12 (-0.04%) |
56.49 |
56.49 - 57.32 |
0.5947 times |
Mon 13 October 2025 |
57.14 (1.96%) |
56.93 |
56.91 - 57.26 |
0.4796 times |
Fri 10 October 2025 |
56.04 (-1.84%) |
57.00 |
56.04 - 57.06 |
0.8441 times |
Weekly price and charts MarketVectors Strong weekly Stock price targets for MarketVectors HAP are 56.34 and 57.74 | Weekly Target 1 | 55.93 | | Weekly Target 2 | 56.75 | | Weekly Target 3 | 57.326666666667 | | Weekly Target 4 | 58.15 | | Weekly Target 5 | 58.73 |
Weekly price and volumes for Market Vectors
| Date |
Closing |
Open |
Range |
Volume |
Fri 24 October 2025 |
57.58 (0.45%) |
57.60 |
56.50 - 57.90 |
0.8938 times |
Fri 17 October 2025 |
57.32 (2.28%) |
56.93 |
56.49 - 58.26 |
2.4668 times |
Fri 10 October 2025 |
56.04 (-2.62%) |
57.78 |
56.04 - 58.14 |
1.1861 times |
Fri 03 October 2025 |
57.55 (0.74%) |
57.37 |
56.75 - 57.71 |
3.0248 times |
Fri 26 September 2025 |
57.13 (2.04%) |
55.99 |
55.96 - 57.18 |
0.447 times |
Fri 19 September 2025 |
55.99 (0.16%) |
55.71 |
55.53 - 56.44 |
0.4298 times |
Fri 12 September 2025 |
55.90 (1.19%) |
55.58 |
55.26 - 56.12 |
0.548 times |
Fri 05 September 2025 |
55.24 (-0.34%) |
55.17 |
54.83 - 55.50 |
0.5351 times |
Fri 29 August 2025 |
55.43 (0%) |
55.31 |
55.31 - 55.48 |
0.0344 times |
Fri 29 August 2025 |
55.43 (0.13%) |
55.33 |
54.96 - 55.48 |
0.4341 times |
Fri 22 August 2025 |
55.36 (2.61%) |
54.05 |
53.68 - 55.43 |
0.6469 times |

Monthly price and charts MarketVectors Strong monthly Stock price targets for MarketVectors HAP are 56.81 and 59.03 | Monthly Target 1 | 55.07 | | Monthly Target 2 | 56.33 | | Monthly Target 3 | 57.293333333333 | | Monthly Target 4 | 58.55 | | Monthly Target 5 | 59.51 |
Monthly price and volumes Market Vectors
| Date |
Closing |
Open |
Range |
Volume |
Fri 24 October 2025 |
57.58 (0.86%) |
57.27 |
56.04 - 58.26 |
1.9934 times |
Tue 30 September 2025 |
57.09 (2.99%) |
55.17 |
54.83 - 57.41 |
0.6245 times |
Fri 29 August 2025 |
55.43 (5.78%) |
52.13 |
51.98 - 55.48 |
0.8459 times |
Thu 31 July 2025 |
52.40 (0.85%) |
52.20 |
52.02 - 54.27 |
0.6798 times |
Mon 30 June 2025 |
51.96 (3.44%) |
50.45 |
50.45 - 52.85 |
0.6587 times |
Fri 30 May 2025 |
50.23 (3.87%) |
48.08 |
48.08 - 50.62 |
0.4876 times |
Wed 30 April 2025 |
48.36 (-2.91%) |
49.74 |
42.65 - 51.10 |
1.1473 times |
Mon 31 March 2025 |
49.81 (3.23%) |
48.76 |
46.86 - 50.51 |
1.0391 times |
Fri 28 February 2025 |
48.25 (0.77%) |
47.18 |
47.18 - 49.58 |
1.1304 times |
Fri 31 January 2025 |
47.88 (5%) |
46.01 |
45.78 - 48.75 |
1.3934 times |
Tue 31 December 2024 |
45.60 (-9.7%) |
50.06 |
45.02 - 50.72 |
4.0353 times |

DMA SMA EMA moving averages of Market Vectors HAP
DMA (daily moving average) of Market Vectors HAP
| DMA period | DMA value | | 5 day DMA | 57.34 | | 12 day DMA | 57.24 | | 20 day DMA | 57.31 | | 35 day DMA | 56.8 | | 50 day DMA | 56.24 | | 100 day DMA | 54.49 | | 150 day DMA | 52.52 | | 200 day DMA | 51.5 | EMA (exponential moving average) of Market Vectors HAP
| EMA period | EMA current | EMA prev | EMA prev2 | | 5 day EMA | 57.39 | 57.3 | 57.18 | | 12 day EMA | 57.3 | 57.25 | 57.2 | | 20 day EMA | 57.15 | 57.1 | 57.05 | | 35 day EMA | 56.67 | 56.62 | 56.56 | | 50 day EMA | 56.14 | 56.08 | 56.02 |
SMA (simple moving average) of Market Vectors HAP
| SMA period | SMA current | SMA prev | SMA prev2 | | 5 day SMA | 57.34 | 57.29 | 57.34 | | 12 day SMA | 57.24 | 57.26 | 57.26 | | 20 day SMA | 57.31 | 57.29 | 57.25 | | 35 day SMA | 56.8 | 56.73 | 56.66 | | 50 day SMA | 56.24 | 56.17 | 56.09 | | 100 day SMA | 54.49 | 54.42 | 54.35 | | 150 day SMA | 52.52 | 52.47 | 52.42 | | 200 day SMA | 51.5 | 51.44 | 51.38 |
|
|
