GsHedge GVIP full analysis,charts,indicators,moving averages,SMA,DMA,EMA,ADX,MACD,RSIGs Hedge GVIP WideScreen charts, DMA,SMA,EMA technical analysis, forecast prediction, by indicators ADX,MACD,RSI,CCI AMEX stock exchange
Daily price and charts and targets GsHedge Strong Daily Stock price targets for GsHedge GVIP are 151.41 and 153.61 | Daily Target 1 | 149.58 | | Daily Target 2 | 151.04 | | Daily Target 3 | 151.77666666667 | | Daily Target 4 | 153.24 | | Daily Target 5 | 153.98 |
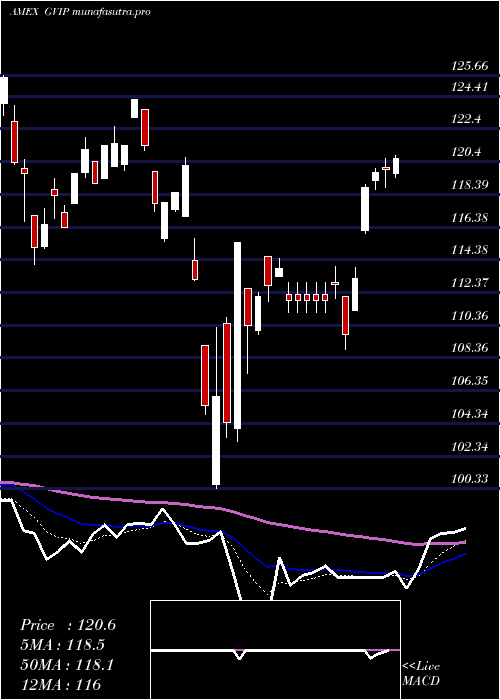
Daily price and volume Gs Hedge
| Date |
Closing |
Open |
Range |
Volume |
Thu 23 October 2025 |
152.51 (2.01%) |
150.31 |
150.31 - 152.51 |
1.8304 times |
Wed 22 October 2025 |
149.51 (-1.9%) |
152.44 |
149.10 - 152.44 |
0.7143 times |
Tue 21 October 2025 |
152.41 (-0.37%) |
152.91 |
152.19 - 152.91 |
1.0568 times |
Mon 20 October 2025 |
152.97 (0.86%) |
152.43 |
152.19 - 153.07 |
0.8623 times |
Fri 17 October 2025 |
151.67 (-0.11%) |
151.10 |
151.05 - 151.67 |
0.552 times |
Thu 16 October 2025 |
151.83 (-0.92%) |
153.91 |
151.83 - 154.15 |
0.8202 times |
Wed 15 October 2025 |
153.24 (0.56%) |
154.69 |
153.24 - 154.69 |
1.5457 times |
Tue 14 October 2025 |
152.39 (-0.54%) |
151.20 |
150.05 - 153.45 |
0.5363 times |
Mon 13 October 2025 |
153.22 (-0.42%) |
152.02 |
151.93 - 153.31 |
0.9306 times |
Tue 07 October 2025 |
153.86 (-0.45%) |
155.00 |
153.13 - 155.00 |
1.1514 times |
Mon 06 October 2025 |
154.56 (0.12%) |
155.71 |
154.56 - 156.05 |
2.2336 times |
Weekly price and charts GsHedge Strong weekly Stock price targets for GsHedge GVIP are 150.81 and 154.78 | Weekly Target 1 | 147.59 | | Weekly Target 2 | 150.05 | | Weekly Target 3 | 151.56 | | Weekly Target 4 | 154.02 | | Weekly Target 5 | 155.53 |
Weekly price and volumes for Gs Hedge
| Date |
Closing |
Open |
Range |
Volume |
Thu 23 October 2025 |
152.51 (0.55%) |
152.43 |
149.10 - 153.07 |
0.8543 times |
Fri 17 October 2025 |
151.67 (-1.42%) |
152.02 |
150.05 - 154.69 |
0.8392 times |
Tue 07 October 2025 |
153.86 (-0.33%) |
155.71 |
153.13 - 156.05 |
0.6478 times |
Fri 03 October 2025 |
154.37 (2.54%) |
153.27 |
151.90 - 155.57 |
2.1314 times |
Fri 26 September 2025 |
150.55 (-1.57%) |
152.68 |
148.91 - 154.39 |
1.5214 times |
Fri 19 September 2025 |
152.95 (1.91%) |
151.51 |
150.00 - 153.30 |
1.3494 times |
Fri 12 September 2025 |
150.09 (3.47%) |
146.36 |
145.65 - 150.66 |
0.8875 times |
Fri 05 September 2025 |
145.06 (1.16%) |
141.25 |
139.57 - 146.53 |
0.7758 times |
Fri 29 August 2025 |
143.39 (0%) |
144.45 |
142.92 - 144.45 |
0.157 times |
Fri 29 August 2025 |
143.39 (0.91%) |
142.21 |
141.79 - 144.45 |
0.8362 times |
Fri 22 August 2025 |
142.10 (0.41%) |
141.58 |
138.35 - 142.55 |
1.0686 times |
Monthly price and charts GsHedge Strong monthly Stock price targets for GsHedge GVIP are 147.33 and 154.28 | Monthly Target 1 | 145.6 | | Monthly Target 2 | 149.06 | | Monthly Target 3 | 152.55333333333 | | Monthly Target 4 | 156.01 | | Monthly Target 5 | 159.5 |
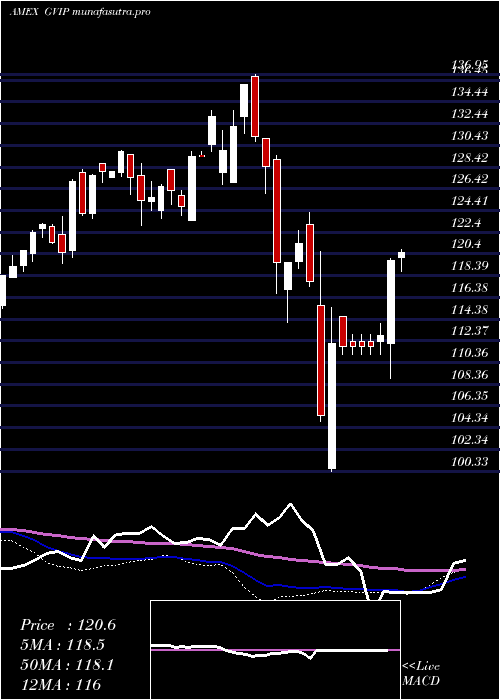
Monthly price and volumes Gs Hedge
| Date |
Closing |
Open |
Range |
Volume |
Thu 23 October 2025 |
152.51 (-0.49%) |
152.77 |
149.10 - 156.05 |
0.6894 times |
Tue 30 September 2025 |
153.26 (6.88%) |
141.25 |
139.57 - 154.39 |
0.8646 times |
Fri 29 August 2025 |
143.39 (1.7%) |
138.90 |
137.70 - 144.45 |
0.5776 times |
Thu 31 July 2025 |
141.00 (1.9%) |
137.85 |
136.52 - 142.28 |
0.7556 times |
Mon 30 June 2025 |
138.37 (6.32%) |
129.74 |
129.72 - 138.37 |
0.9457 times |
Fri 30 May 2025 |
130.14 (8.05%) |
121.47 |
121.42 - 131.53 |
1.1319 times |
Wed 30 April 2025 |
120.44 (2.17%) |
117.44 |
100.33 - 120.78 |
1.7278 times |
Mon 31 March 2025 |
117.88 (-8.26%) |
129.08 |
114.07 - 129.50 |
1.4131 times |
Fri 28 February 2025 |
128.49 (-1.13%) |
127.00 |
125.98 - 136.95 |
0.8047 times |
Fri 31 January 2025 |
129.96 (4.75%) |
125.14 |
123.49 - 133.63 |
1.0897 times |
Tue 31 December 2024 |
124.07 (-3.09%) |
127.91 |
123.05 - 130.00 |
0.5097 times |

DMA SMA EMA moving averages of Gs Hedge GVIP
DMA (daily moving average) of Gs Hedge GVIP
| DMA period | DMA value | | 5 day DMA | 151.81 | | 12 day DMA | 152.71 | | 20 day DMA | 152.69 | | 35 day DMA | 151.1 | | 50 day DMA | 148.4 | | 100 day DMA | 142.5 | | 150 day DMA | 134.93 | | 200 day DMA | 133.19 | EMA (exponential moving average) of Gs Hedge GVIP
| EMA period | EMA current | EMA prev | EMA prev2 | | 5 day EMA | 151.86 | 151.53 | 152.54 | | 12 day EMA | 152.23 | 152.18 | 152.67 | | 20 day EMA | 151.95 | 151.89 | 152.14 | | 35 day EMA | 150.06 | 149.92 | 149.94 | | 50 day EMA | 147.97 | 147.78 | 147.71 |
SMA (simple moving average) of Gs Hedge GVIP
| SMA period | SMA current | SMA prev | SMA prev2 | | 5 day SMA | 151.81 | 151.68 | 152.42 | | 12 day SMA | 152.71 | 152.89 | 153.31 | | 20 day SMA | 152.69 | 152.79 | 152.96 | | 35 day SMA | 151.1 | 150.84 | 150.66 | | 50 day SMA | 148.4 | 148.13 | 147.93 | | 100 day SMA | 142.5 | 142.28 | 142.07 | | 150 day SMA | 134.93 | 134.72 | 134.52 | | 200 day SMA | 133.19 | 133.06 | 132.94 |
|
|
