IntermGovt GVI full analysis,charts,indicators,moving averages,SMA,DMA,EMA,ADX,MACD,RSIInterm Govt GVI WideScreen charts, DMA,SMA,EMA technical analysis, forecast prediction, by indicators ADX,MACD,RSI,CCI AMEX stock exchange
Daily price and charts and targets IntermGovt Strong Daily Stock price targets for IntermGovt GVI are 107.82 and 107.93 | Daily Target 1 | 107.79 | | Daily Target 2 | 107.84 | | Daily Target 3 | 107.90333333333 | | Daily Target 4 | 107.95 | | Daily Target 5 | 108.01 |
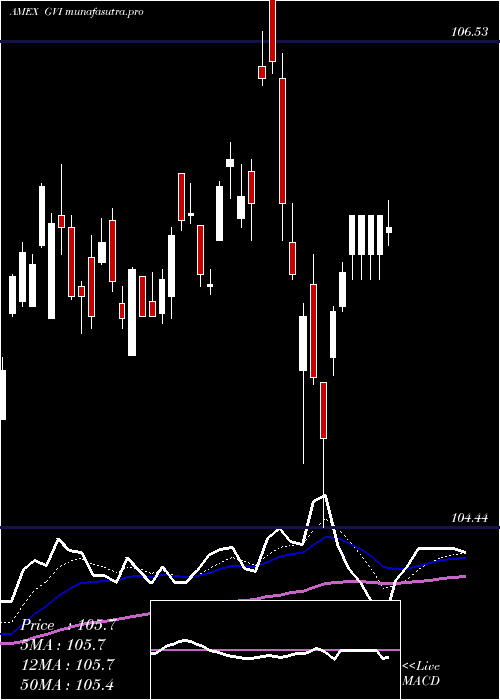
Daily price and volume Interm Govt
| Date |
Closing |
Open |
Range |
Volume |
Thu 23 October 2025 |
107.88 (-0.14%) |
107.97 |
107.86 - 107.97 |
0.7817 times |
Wed 22 October 2025 |
108.03 (0.04%) |
108.02 |
107.94 - 108.03 |
0.5164 times |
Tue 21 October 2025 |
107.99 (0.05%) |
108.06 |
107.98 - 108.06 |
1.0617 times |
Mon 20 October 2025 |
107.94 (0.06%) |
107.87 |
107.87 - 107.94 |
0.8491 times |
Fri 17 October 2025 |
107.87 (-0.06%) |
107.98 |
107.83 - 107.98 |
0.5637 times |
Thu 16 October 2025 |
107.93 (0.23%) |
107.66 |
107.63 - 108.00 |
2.3421 times |
Wed 15 October 2025 |
107.68 (-0.06%) |
107.78 |
107.66 - 107.82 |
0.6408 times |
Tue 14 October 2025 |
107.74 (0.06%) |
107.58 |
107.56 - 107.78 |
0.7688 times |
Mon 13 October 2025 |
107.68 (0.18%) |
107.57 |
107.48 - 107.68 |
1.7687 times |
Fri 10 October 2025 |
107.49 (0.27%) |
107.38 |
107.34 - 107.57 |
0.707 times |
Thu 09 October 2025 |
107.20 (-0.07%) |
107.21 |
107.18 - 107.24 |
0.5575 times |
Weekly price and charts IntermGovt Strong weekly Stock price targets for IntermGovt GVI are 107.87 and 108.07 | Weekly Target 1 | 107.73 | | Weekly Target 2 | 107.81 | | Weekly Target 3 | 107.93333333333 | | Weekly Target 4 | 108.01 | | Weekly Target 5 | 108.13 |
Weekly price and volumes for Interm Govt
| Date |
Closing |
Open |
Range |
Volume |
Thu 23 October 2025 |
107.88 (0.01%) |
107.87 |
107.86 - 108.06 |
0.5503 times |
Fri 17 October 2025 |
107.87 (0.35%) |
107.57 |
107.48 - 108.00 |
1.0434 times |
Fri 10 October 2025 |
107.49 (0.19%) |
107.22 |
107.17 - 107.57 |
0.5435 times |
Fri 03 October 2025 |
107.29 (0.04%) |
107.32 |
107.26 - 107.55 |
1.0968 times |
Fri 26 September 2025 |
107.25 (-0.29%) |
107.58 |
107.15 - 107.58 |
0.9748 times |
Fri 19 September 2025 |
107.56 (-0.05%) |
107.67 |
107.44 - 107.95 |
3.2449 times |
Fri 12 September 2025 |
107.61 (0.07%) |
107.73 |
107.50 - 107.84 |
0.877 times |
Fri 05 September 2025 |
107.53 (0.21%) |
106.71 |
106.71 - 107.71 |
0.8499 times |
Fri 29 August 2025 |
107.31 (0%) |
107.30 |
107.22 - 107.32 |
0.1274 times |
Fri 29 August 2025 |
107.31 (0.23%) |
106.91 |
106.91 - 107.32 |
0.6921 times |
Fri 22 August 2025 |
107.06 (0.32%) |
106.71 |
106.59 - 107.11 |
1.0568 times |

Monthly price and charts IntermGovt Strong monthly Stock price targets for IntermGovt GVI are 107.53 and 108.42 | Monthly Target 1 | 106.81 | | Monthly Target 2 | 107.35 | | Monthly Target 3 | 107.70333333333 | | Monthly Target 4 | 108.24 | | Monthly Target 5 | 108.59 |
Monthly price and volumes Interm Govt
| Date |
Closing |
Open |
Range |
Volume |
Thu 23 October 2025 |
107.88 (0.41%) |
107.41 |
107.17 - 108.06 |
0.6878 times |
Tue 30 September 2025 |
107.44 (0.12%) |
106.71 |
106.71 - 107.95 |
1.4927 times |
Fri 29 August 2025 |
107.31 (0.87%) |
106.59 |
106.55 - 107.32 |
0.8733 times |
Thu 31 July 2025 |
106.38 (-0.38%) |
106.48 |
105.76 - 106.53 |
1.0831 times |
Mon 30 June 2025 |
106.79 (0.75%) |
105.46 |
105.26 - 106.84 |
0.5428 times |
Fri 30 May 2025 |
106.00 (-0.53%) |
106.28 |
105.05 - 106.46 |
0.9362 times |
Wed 30 April 2025 |
106.57 (0.52%) |
105.77 |
104.44 - 107.00 |
1.1345 times |
Mon 31 March 2025 |
106.02 (0.11%) |
105.33 |
105.18 - 106.10 |
1.0444 times |
Fri 28 February 2025 |
105.90 (1.13%) |
104.43 |
104.02 - 105.91 |
0.68 times |
Fri 31 January 2025 |
104.72 (0.47%) |
104.34 |
103.45 - 104.85 |
1.5252 times |
Tue 31 December 2024 |
104.23 (-0.72%) |
105.37 |
103.77 - 105.46 |
1.0597 times |

DMA SMA EMA moving averages of Interm Govt GVI
DMA (daily moving average) of Interm Govt GVI
| DMA period | DMA value | | 5 day DMA | 107.94 | | 12 day DMA | 107.73 | | 20 day DMA | 107.57 | | 35 day DMA | 107.57 | | 50 day DMA | 107.4 | | 100 day DMA | 106.81 | | 150 day DMA | 106.44 | | 200 day DMA | 106.03 | EMA (exponential moving average) of Interm Govt GVI
| EMA period | EMA current | EMA prev | EMA prev2 | | 5 day EMA | 107.91 | 107.93 | 107.88 | | 12 day EMA | 107.78 | 107.76 | 107.71 | | 20 day EMA | 107.67 | 107.65 | 107.61 | | 35 day EMA | 107.5 | 107.48 | 107.45 | | 50 day EMA | 107.41 | 107.39 | 107.36 |
SMA (simple moving average) of Interm Govt GVI
| SMA period | SMA current | SMA prev | SMA prev2 | | 5 day SMA | 107.94 | 107.95 | 107.88 | | 12 day SMA | 107.73 | 107.68 | 107.61 | | 20 day SMA | 107.57 | 107.53 | 107.5 | | 35 day SMA | 107.57 | 107.55 | 107.52 | | 50 day SMA | 107.4 | 107.38 | 107.36 | | 100 day SMA | 106.81 | 106.79 | 106.77 | | 150 day SMA | 106.44 | 106.42 | 106.41 | | 200 day SMA | 106.03 | 106.01 | 105.99 |
|
|
