GlobalX GURU full analysis,charts,indicators,moving averages,SMA,DMA,EMA,ADX,MACD,RSIGlobal X GURU WideScreen charts, DMA,SMA,EMA technical analysis, forecast prediction, by indicators ADX,MACD,RSI,CCI AMEX stock exchange
Daily price and charts and targets GlobalX Strong Daily Stock price targets for GlobalX GURU are 60.88 and 61.17 | Daily Target 1 | 60.83 | | Daily Target 2 | 60.92 | | Daily Target 3 | 61.116666666667 | | Daily Target 4 | 61.21 | | Daily Target 5 | 61.41 |
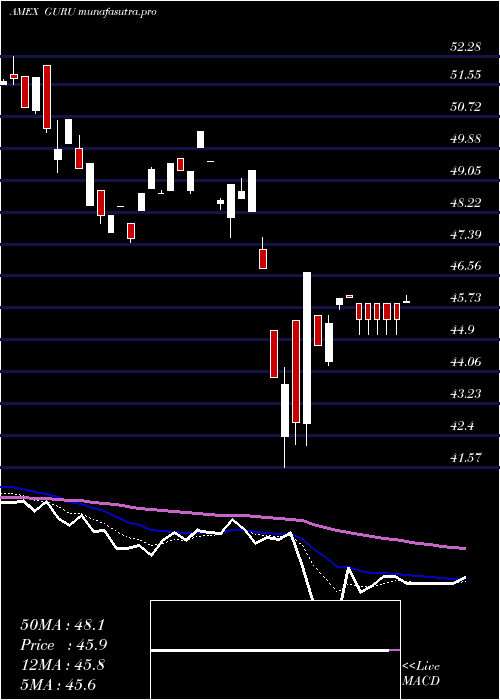
Daily price and volume Global X
| Date |
Closing |
Open |
Range |
Volume |
Fri 24 October 2025 |
61.02 (1.85%) |
61.31 |
61.02 - 61.31 |
1.1501 times |
Thu 23 October 2025 |
59.91 (0%) |
60.55 |
60.55 - 60.55 |
0 times |
Wed 22 October 2025 |
59.91 (-1.09%) |
59.92 |
59.91 - 60.04 |
0.8294 times |
Tue 21 October 2025 |
60.57 (-0.36%) |
60.68 |
60.57 - 60.68 |
0.9201 times |
Mon 20 October 2025 |
60.79 (1.38%) |
60.44 |
60.16 - 60.79 |
1.4879 times |
Fri 17 October 2025 |
59.96 (0.15%) |
59.88 |
59.64 - 59.96 |
1.3131 times |
Thu 16 October 2025 |
59.87 (-0.83%) |
60.67 |
59.69 - 60.67 |
1.2763 times |
Wed 15 October 2025 |
60.37 (1.19%) |
60.25 |
60.25 - 60.58 |
0.7886 times |
Tue 14 October 2025 |
59.66 (0.61%) |
58.65 |
58.65 - 59.96 |
1.4458 times |
Mon 13 October 2025 |
59.30 (1.66%) |
59.13 |
59.13 - 59.30 |
0.7886 times |
Fri 10 October 2025 |
58.33 (-2.78%) |
59.03 |
58.33 - 59.03 |
1.3144 times |
Weekly price and charts GlobalX Strong weekly Stock price targets for GlobalX GURU are 60.47 and 61.87 | Weekly Target 1 | 59.35 | | Weekly Target 2 | 60.18 | | Weekly Target 3 | 60.746666666667 | | Weekly Target 4 | 61.58 | | Weekly Target 5 | 62.15 |
Weekly price and volumes for Global X
| Date |
Closing |
Open |
Range |
Volume |
Fri 24 October 2025 |
61.02 (1.77%) |
60.44 |
59.91 - 61.31 |
0.7026 times |
Fri 17 October 2025 |
59.96 (2.79%) |
59.13 |
58.65 - 60.67 |
0.8988 times |
Fri 10 October 2025 |
58.33 (-2.99%) |
60.42 |
58.33 - 60.51 |
1.0026 times |
Fri 03 October 2025 |
60.13 (0.02%) |
59.83 |
59.23 - 60.30 |
1.3758 times |
Fri 26 September 2025 |
60.12 (0.12%) |
59.81 |
59.04 - 60.26 |
1.284 times |
Fri 19 September 2025 |
60.05 (0.59%) |
59.60 |
59.33 - 60.07 |
1.4735 times |
Fri 12 September 2025 |
59.70 (1.51%) |
59.08 |
58.75 - 59.85 |
1.4524 times |
Fri 05 September 2025 |
58.81 (1.92%) |
57.49 |
57.42 - 58.85 |
0.7367 times |
Fri 29 August 2025 |
57.70 (0%) |
58.00 |
57.70 - 58.00 |
0.1684 times |
Fri 29 August 2025 |
57.70 (0.3%) |
57.30 |
57.16 - 58.06 |
0.9051 times |
Fri 22 August 2025 |
57.53 (1.84%) |
56.32 |
55.80 - 57.60 |
1.9155 times |

Monthly price and charts GlobalX Strong monthly Stock price targets for GlobalX GURU are 59.68 and 62.66 | Monthly Target 1 | 57.24 | | Monthly Target 2 | 59.13 | | Monthly Target 3 | 60.22 | | Monthly Target 4 | 62.11 | | Monthly Target 5 | 63.2 |
Monthly price and volumes Global X
| Date |
Closing |
Open |
Range |
Volume |
Fri 24 October 2025 |
61.02 (2.43%) |
59.62 |
58.33 - 61.31 |
0.3875 times |
Tue 30 September 2025 |
59.57 (3.24%) |
57.49 |
57.42 - 60.26 |
0.6791 times |
Fri 29 August 2025 |
57.70 (5.33%) |
54.29 |
53.80 - 58.06 |
1.1997 times |
Thu 31 July 2025 |
54.78 (2.16%) |
53.31 |
53.24 - 55.37 |
1.6313 times |
Mon 30 June 2025 |
53.62 (3.98%) |
51.50 |
51.50 - 53.65 |
1.2953 times |
Fri 30 May 2025 |
51.57 (6.18%) |
49.16 |
48.96 - 51.95 |
1.1092 times |
Wed 30 April 2025 |
48.57 (-0.76%) |
48.57 |
41.57 - 49.32 |
0.9873 times |
Mon 31 March 2025 |
48.94 (-5.38%) |
52.04 |
47.43 - 52.04 |
0.6358 times |
Fri 28 February 2025 |
51.72 (-1.77%) |
51.33 |
50.80 - 53.92 |
1.0262 times |
Fri 31 January 2025 |
52.65 (5.53%) |
50.40 |
49.24 - 53.19 |
1.0488 times |
Tue 31 December 2024 |
49.89 (-6.19%) |
53.12 |
49.62 - 53.12 |
0.6385 times |

DMA SMA EMA moving averages of Global X GURU
DMA (daily moving average) of Global X GURU
| DMA period | DMA value | | 5 day DMA | 60.44 | | 12 day DMA | 59.97 | | 20 day DMA | 59.96 | | 35 day DMA | 59.83 | | 50 day DMA | 59.11 | | 100 day DMA | 56.56 | | 150 day DMA | 53.85 | | 200 day DMA | 53.22 | EMA (exponential moving average) of Global X GURU
| EMA period | EMA current | EMA prev | EMA prev2 | | 5 day EMA | 60.4 | 60.09 | 60.18 | | 12 day EMA | 60.16 | 60 | 60.02 | | 20 day EMA | 59.97 | 59.86 | 59.86 | | 35 day EMA | 59.45 | 59.36 | 59.33 | | 50 day EMA | 59 | 58.92 | 58.88 |
SMA (simple moving average) of Global X GURU
| SMA period | SMA current | SMA prev | SMA prev2 | | 5 day SMA | 60.44 | 60.23 | 60.22 | | 12 day SMA | 59.97 | 59.92 | 59.92 | | 20 day SMA | 59.96 | 59.92 | 59.89 | | 35 day SMA | 59.83 | 59.77 | 59.72 | | 50 day SMA | 59.11 | 59.02 | 58.96 | | 100 day SMA | 56.56 | 56.47 | 56.39 | | 150 day SMA | 53.85 | 53.78 | 53.7 | | 200 day SMA | 53.22 | 53.17 | 53.12 |
|
|
