GuggenheimTotal GTO full analysis,charts,indicators,moving averages,SMA,DMA,EMA,ADX,MACD,RSIGuggenheim Total GTO WideScreen charts, DMA,SMA,EMA technical analysis, forecast prediction, by indicators ADX,MACD,RSI,CCI AMEX stock exchange
Daily price and charts and targets GuggenheimTotal Strong Daily Stock price targets for GuggenheimTotal GTO are 47.75 and 47.82 | Daily Target 1 | 47.73 | | Daily Target 2 | 47.76 | | Daily Target 3 | 47.8 | | Daily Target 4 | 47.83 | | Daily Target 5 | 47.87 |
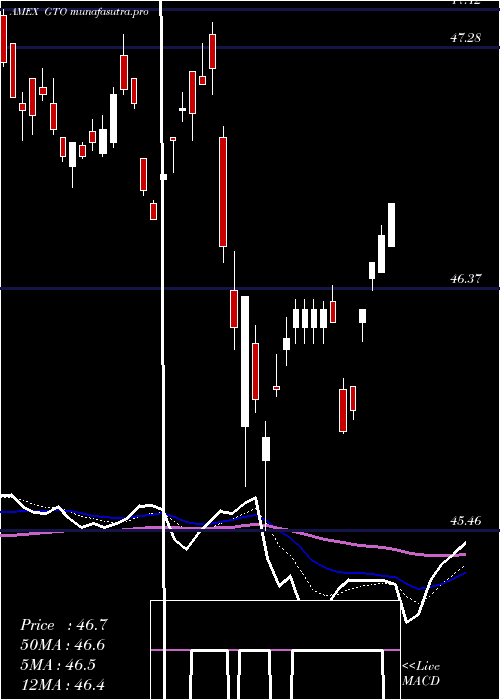
Daily price and volume Guggenheim Total
| Date |
Closing |
Open |
Range |
Volume |
Thu 23 October 2025 |
47.79 (-0.13%) |
47.80 |
47.77 - 47.84 |
1.082 times |
Wed 22 October 2025 |
47.85 (0.04%) |
47.85 |
47.80 - 47.87 |
0.9371 times |
Tue 21 October 2025 |
47.83 (0.13%) |
47.85 |
47.82 - 47.88 |
0.8722 times |
Mon 20 October 2025 |
47.77 (-0.31%) |
47.77 |
47.74 - 47.79 |
0.541 times |
Fri 17 October 2025 |
47.92 (-0.02%) |
47.92 |
47.86 - 47.94 |
1.2894 times |
Thu 16 October 2025 |
47.93 (0.31%) |
47.81 |
47.78 - 47.95 |
0.732 times |
Wed 15 October 2025 |
47.78 (0.02%) |
47.83 |
47.76 - 47.89 |
1.1107 times |
Tue 14 October 2025 |
47.77 (0.15%) |
47.67 |
47.67 - 47.81 |
1.4044 times |
Mon 13 October 2025 |
47.70 (0.21%) |
47.64 |
47.60 - 47.72 |
0.7147 times |
Fri 10 October 2025 |
47.60 (0.17%) |
47.63 |
47.57 - 47.65 |
1.3166 times |
Thu 09 October 2025 |
47.52 (-0.13%) |
47.59 |
47.49 - 47.59 |
0.9373 times |
Weekly price and charts GuggenheimTotal Strong weekly Stock price targets for GuggenheimTotal GTO are 47.77 and 47.91 | Weekly Target 1 | 47.66 | | Weekly Target 2 | 47.73 | | Weekly Target 3 | 47.803333333333 | | Weekly Target 4 | 47.87 | | Weekly Target 5 | 47.94 |
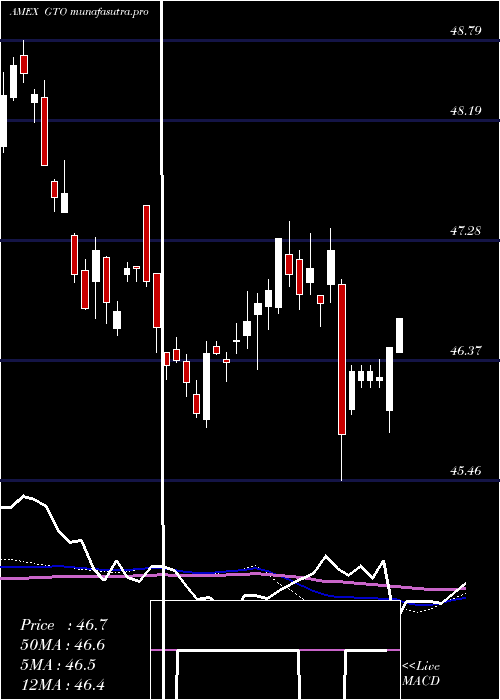
Weekly price and volumes for Guggenheim Total
| Date |
Closing |
Open |
Range |
Volume |
Thu 23 October 2025 |
47.79 (-0.27%) |
47.77 |
47.74 - 47.88 |
0.6291 times |
Fri 17 October 2025 |
47.92 (0.67%) |
47.64 |
47.60 - 47.95 |
0.9625 times |
Fri 10 October 2025 |
47.60 (-0.02%) |
47.55 |
47.49 - 47.67 |
0.9362 times |
Fri 03 October 2025 |
47.61 (0.44%) |
47.46 |
47.46 - 47.68 |
1.2709 times |
Fri 26 September 2025 |
47.40 (-0.69%) |
47.54 |
47.33 - 47.55 |
1.7312 times |
Fri 19 September 2025 |
47.73 (-0.1%) |
47.85 |
47.68 - 48.01 |
1.4012 times |
Fri 12 September 2025 |
47.78 (0.65%) |
47.57 |
47.54 - 47.81 |
1.4971 times |
Fri 05 September 2025 |
47.47 (0.91%) |
46.90 |
46.90 - 47.52 |
0.6633 times |
Fri 29 August 2025 |
47.04 (0%) |
47.04 |
47.00 - 47.08 |
0.1327 times |
Fri 29 August 2025 |
47.04 (0.11%) |
46.97 |
46.92 - 47.12 |
0.7756 times |
Fri 22 August 2025 |
46.99 (0%) |
46.83 |
46.70 - 47.01 |
0.997 times |
Monthly price and charts GuggenheimTotal Strong monthly Stock price targets for GuggenheimTotal GTO are 47.64 and 48.1 | Monthly Target 1 | 47.28 | | Monthly Target 2 | 47.54 | | Monthly Target 3 | 47.743333333333 | | Monthly Target 4 | 48 | | Monthly Target 5 | 48.2 |
Monthly price and volumes Guggenheim Total
| Date |
Closing |
Open |
Range |
Volume |
Thu 23 October 2025 |
47.79 (0.59%) |
47.56 |
47.49 - 47.95 |
0.5611 times |
Tue 30 September 2025 |
47.51 (1%) |
46.90 |
46.90 - 48.01 |
1.0268 times |
Fri 29 August 2025 |
47.04 (0.9%) |
46.85 |
46.70 - 47.19 |
0.7552 times |
Thu 31 July 2025 |
46.62 (-0.58%) |
46.89 |
46.39 - 46.92 |
1.5279 times |
Mon 30 June 2025 |
46.89 (1.36%) |
46.18 |
46.11 - 46.90 |
0.9181 times |
Fri 30 May 2025 |
46.26 (-0.86%) |
46.75 |
45.65 - 46.75 |
1.112 times |
Wed 30 April 2025 |
46.66 (-0.58%) |
47.04 |
45.46 - 47.37 |
1.1161 times |
Mon 31 March 2025 |
46.93 (-0.76%) |
47.17 |
46.63 - 47.42 |
0.9133 times |
Fri 28 February 2025 |
47.29 (1.66%) |
46.56 |
46.30 - 47.29 |
1.0968 times |
Fri 31 January 2025 |
46.52 (0.26%) |
46.50 |
45.86 - 46.65 |
0.9728 times |
Tue 31 December 2024 |
46.40 (-1.42%) |
47.54 |
46.23 - 47.54 |
0.6403 times |

DMA SMA EMA moving averages of Guggenheim Total GTO
DMA (daily moving average) of Guggenheim Total GTO
| DMA period | DMA value | | 5 day DMA | 47.83 | | 12 day DMA | 47.75 | | 20 day DMA | 47.67 | | 35 day DMA | 47.67 | | 50 day DMA | 47.46 | | 100 day DMA | 47.05 | | 150 day DMA | 46.82 | | 200 day DMA | 46.78 | EMA (exponential moving average) of Guggenheim Total GTO
| EMA period | EMA current | EMA prev | EMA prev2 | | 5 day EMA | 47.82 | 47.83 | 47.82 | | 12 day EMA | 47.77 | 47.77 | 47.75 | | 20 day EMA | 47.72 | 47.71 | 47.69 | | 35 day EMA | 47.58 | 47.57 | 47.55 | | 50 day EMA | 47.46 | 47.45 | 47.43 |
SMA (simple moving average) of Guggenheim Total GTO
| SMA period | SMA current | SMA prev | SMA prev2 | | 5 day SMA | 47.83 | 47.86 | 47.85 | | 12 day SMA | 47.75 | 47.74 | 47.71 | | 20 day SMA | 47.67 | 47.65 | 47.63 | | 35 day SMA | 47.67 | 47.65 | 47.63 | | 50 day SMA | 47.46 | 47.45 | 47.43 | | 100 day SMA | 47.05 | 47.03 | 47.01 | | 150 day SMA | 46.82 | 46.81 | 46.81 | | 200 day SMA | 46.78 | 46.78 | 46.77 |
|
|
