GsActivebeta GSSC full analysis,charts,indicators,moving averages,SMA,DMA,EMA,ADX,MACD,RSIGs Activebeta GSSC WideScreen charts, DMA,SMA,EMA technical analysis, forecast prediction, by indicators ADX,MACD,RSI,CCI AMEX stock exchange
Daily price and charts and targets GsActivebeta Strong Daily Stock price targets for GsActivebeta GSSC are 76.11 and 76.49 | Daily Target 1 | 76.05 | | Daily Target 2 | 76.17 | | Daily Target 3 | 76.426666666667 | | Daily Target 4 | 76.55 | | Daily Target 5 | 76.81 |
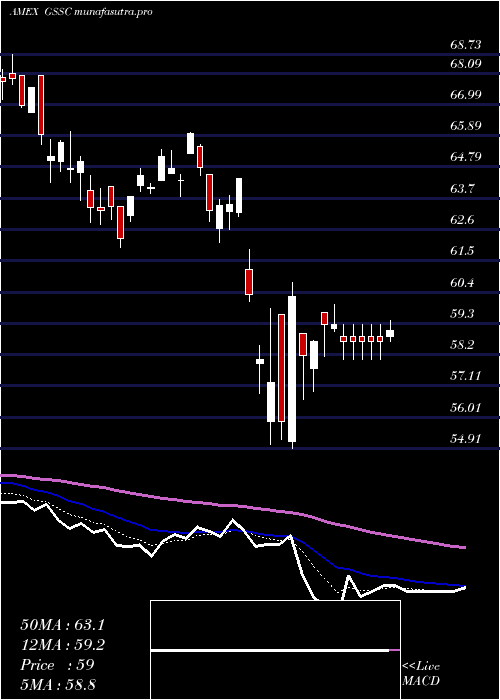
Daily price and volume Gs Activebeta
| Date |
Closing |
Open |
Range |
Volume |
Fri 24 October 2025 |
76.30 (1.02%) |
76.43 |
76.30 - 76.68 |
0.9612 times |
Thu 23 October 2025 |
75.53 (1.25%) |
74.93 |
74.74 - 75.65 |
0.5612 times |
Wed 22 October 2025 |
74.60 (-1.19%) |
75.23 |
73.90 - 75.38 |
0.973 times |
Tue 21 October 2025 |
75.50 (0.16%) |
75.05 |
74.81 - 75.66 |
1.3951 times |
Mon 20 October 2025 |
75.38 (1.81%) |
74.85 |
74.82 - 75.39 |
1.1677 times |
Fri 17 October 2025 |
74.04 (-0.42%) |
73.85 |
73.57 - 74.40 |
1.0836 times |
Thu 16 October 2025 |
74.35 (-1.95%) |
76.15 |
74.15 - 76.15 |
0.618 times |
Wed 15 October 2025 |
75.83 (0.53%) |
76.12 |
75.31 - 76.53 |
0.8494 times |
Tue 14 October 2025 |
75.43 (1.56%) |
73.24 |
73.18 - 75.80 |
0.9563 times |
Mon 13 October 2025 |
74.27 (2.55%) |
73.79 |
73.53 - 74.35 |
1.4345 times |
Fri 10 October 2025 |
72.42 (-3.31%) |
75.03 |
72.42 - 75.15 |
1.8789 times |
Weekly price and charts GsActivebeta Strong weekly Stock price targets for GsActivebeta GSSC are 75.1 and 77.88 | Weekly Target 1 | 72.85 | | Weekly Target 2 | 74.57 | | Weekly Target 3 | 75.626666666667 | | Weekly Target 4 | 77.35 | | Weekly Target 5 | 78.41 |
Weekly price and volumes for Gs Activebeta
| Date |
Closing |
Open |
Range |
Volume |
Fri 24 October 2025 |
76.30 (3.05%) |
74.85 |
73.90 - 76.68 |
0.4902 times |
Fri 17 October 2025 |
74.04 (2.24%) |
73.79 |
73.18 - 76.53 |
0.4789 times |
Fri 10 October 2025 |
72.42 (-4.19%) |
71.48 |
71.48 - 76.25 |
0.767 times |
Fri 03 October 2025 |
75.59 (0.61%) |
75.60 |
74.20 - 76.42 |
0.7962 times |
Fri 26 September 2025 |
75.13 (-1.16%) |
75.80 |
74.02 - 77.21 |
1.1916 times |
Fri 19 September 2025 |
76.01 (1.67%) |
75.12 |
74.42 - 77.03 |
1.3824 times |
Fri 12 September 2025 |
74.76 (-0.16%) |
74.64 |
74.00 - 75.72 |
2.217 times |
Fri 05 September 2025 |
74.88 (0.79%) |
73.26 |
73.22 - 75.28 |
0.9365 times |
Fri 29 August 2025 |
74.29 (0%) |
74.71 |
74.11 - 74.71 |
0.2682 times |
Fri 29 August 2025 |
74.29 (0.16%) |
73.98 |
73.57 - 74.73 |
1.4718 times |
Fri 22 August 2025 |
74.17 (3.5%) |
71.68 |
70.94 - 74.40 |
0.985 times |

Monthly price and charts GsActivebeta Strong monthly Stock price targets for GsActivebeta GSSC are 73.89 and 79.09 | Monthly Target 1 | 69.62 | | Monthly Target 2 | 72.96 | | Monthly Target 3 | 74.82 | | Monthly Target 4 | 78.16 | | Monthly Target 5 | 80.02 |
Monthly price and volumes Gs Activebeta
| Date |
Closing |
Open |
Range |
Volume |
Fri 24 October 2025 |
76.30 (1.88%) |
74.47 |
71.48 - 76.68 |
0.5634 times |
Tue 30 September 2025 |
74.89 (0.81%) |
73.26 |
73.22 - 77.21 |
1.5668 times |
Fri 29 August 2025 |
74.29 (7.95%) |
67.84 |
66.81 - 74.73 |
0.9516 times |
Thu 31 July 2025 |
68.82 (0.31%) |
68.25 |
68.25 - 71.08 |
0.5068 times |
Mon 30 June 2025 |
68.61 (4.68%) |
65.58 |
64.77 - 68.91 |
0.9953 times |
Fri 30 May 2025 |
65.54 (6.62%) |
61.59 |
61.59 - 66.88 |
0.8396 times |
Wed 30 April 2025 |
61.47 (-3.09%) |
63.25 |
54.91 - 64.39 |
1.607 times |
Mon 31 March 2025 |
63.43 (-6.17%) |
68.00 |
61.97 - 68.00 |
0.961 times |
Fri 28 February 2025 |
67.60 (-4.72%) |
69.40 |
66.70 - 73.84 |
1.0787 times |
Fri 31 January 2025 |
70.95 (2.63%) |
69.85 |
66.93 - 72.07 |
0.9299 times |
Tue 31 December 2024 |
69.13 (-8.69%) |
76.12 |
68.07 - 76.12 |
1.0351 times |

DMA SMA EMA moving averages of Gs Activebeta GSSC
DMA (daily moving average) of Gs Activebeta GSSC
| DMA period | DMA value | | 5 day DMA | 75.46 | | 12 day DMA | 74.88 | | 20 day DMA | 75 | | 35 day DMA | 75.11 | | 50 day DMA | 74.64 | | 100 day DMA | 71.8 | | 150 day DMA | 68.66 | | 200 day DMA | 68.6 | EMA (exponential moving average) of Gs Activebeta GSSC
| EMA period | EMA current | EMA prev | EMA prev2 | | 5 day EMA | 75.51 | 75.11 | 74.9 | | 12 day EMA | 75.19 | 74.99 | 74.89 | | 20 day EMA | 75.05 | 74.92 | 74.86 | | 35 day EMA | 74.71 | 74.62 | 74.57 | | 50 day EMA | 74.46 | 74.39 | 74.34 |
SMA (simple moving average) of Gs Activebeta GSSC
| SMA period | SMA current | SMA prev | SMA prev2 | | 5 day SMA | 75.46 | 75.01 | 74.77 | | 12 day SMA | 74.88 | 74.81 | 74.75 | | 20 day SMA | 75 | 74.94 | 74.88 | | 35 day SMA | 75.11 | 75.07 | 75.04 | | 50 day SMA | 74.64 | 74.54 | 74.47 | | 100 day SMA | 71.8 | 71.69 | 71.59 | | 150 day SMA | 68.66 | 68.58 | 68.51 | | 200 day SMA | 68.6 | 68.57 | 68.54 |
|
|
