GoldmanSachs GSLC full analysis,charts,indicators,moving averages,SMA,DMA,EMA,ADX,MACD,RSIGoldman Sachs GSLC WideScreen charts, DMA,SMA,EMA technical analysis, forecast prediction, by indicators ADX,MACD,RSI,CCI AMEX stock exchange
Daily price and charts and targets GoldmanSachs Strong Daily Stock price targets for GoldmanSachs GSLC are 130.2 and 131.04 | Daily Target 1 | 129.53 | | Daily Target 2 | 130.02 | | Daily Target 3 | 130.37333333333 | | Daily Target 4 | 130.86 | | Daily Target 5 | 131.21 |
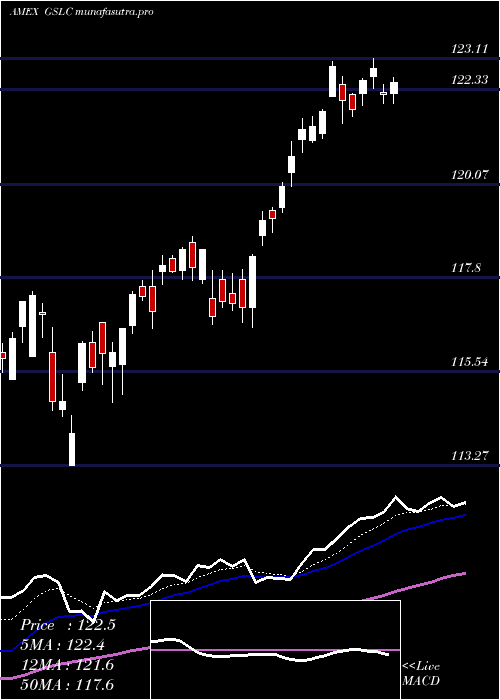
Daily price and volume Goldman Sachs
| Date |
Closing |
Open |
Range |
Volume |
Thu 23 October 2025 |
130.50 (0.53%) |
130.00 |
129.89 - 130.73 |
0.9323 times |
Wed 22 October 2025 |
129.81 (-0.57%) |
130.63 |
129.09 - 130.63 |
0.8404 times |
Tue 21 October 2025 |
130.56 (0.13%) |
130.51 |
130.23 - 130.91 |
0.798 times |
Mon 20 October 2025 |
130.39 (1.01%) |
129.60 |
129.60 - 130.61 |
0.7509 times |
Fri 17 October 2025 |
129.09 (0.63%) |
127.95 |
127.90 - 129.32 |
0.7193 times |
Thu 16 October 2025 |
128.28 (-0.81%) |
129.52 |
127.67 - 129.93 |
2.2218 times |
Wed 15 October 2025 |
129.33 (0.32%) |
129.86 |
128.25 - 130.45 |
1.0256 times |
Tue 14 October 2025 |
128.92 (0%) |
127.76 |
127.27 - 129.56 |
0.9165 times |
Mon 13 October 2025 |
128.92 (1.39%) |
128.53 |
128.33 - 129.19 |
0.8318 times |
Fri 10 October 2025 |
127.15 (-2.58%) |
130.64 |
127.06 - 130.97 |
0.9635 times |
Thu 09 October 2025 |
130.52 (-0.28%) |
131.09 |
130.21 - 131.09 |
0.8983 times |
Weekly price and charts GoldmanSachs Strong weekly Stock price targets for GoldmanSachs GSLC are 129.8 and 131.62 | Weekly Target 1 | 128.35 | | Weekly Target 2 | 129.42 | | Weekly Target 3 | 130.16666666667 | | Weekly Target 4 | 131.24 | | Weekly Target 5 | 131.99 |
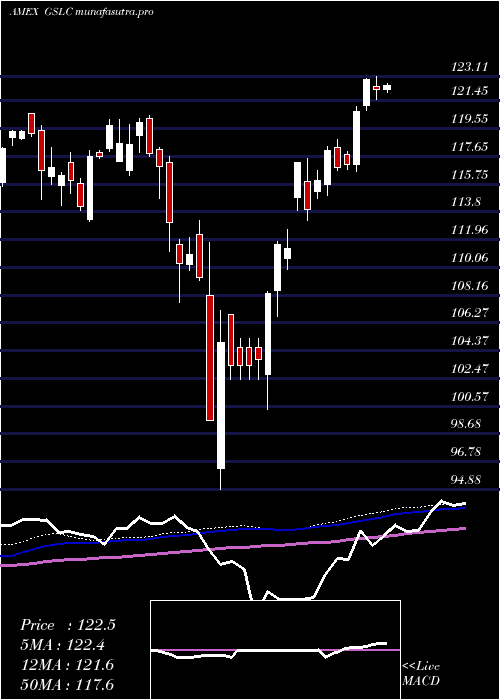
Weekly price and volumes for Goldman Sachs
| Date |
Closing |
Open |
Range |
Volume |
Thu 23 October 2025 |
130.50 (1.09%) |
129.60 |
129.09 - 130.91 |
0.5493 times |
Fri 17 October 2025 |
129.09 (1.53%) |
128.53 |
127.27 - 130.45 |
0.9451 times |
Fri 10 October 2025 |
127.15 (-2.69%) |
130.96 |
127.06 - 131.09 |
0.7796 times |
Fri 03 October 2025 |
130.66 (0.8%) |
130.18 |
129.47 - 131.30 |
0.8032 times |
Fri 26 September 2025 |
129.62 (-0.54%) |
130.02 |
128.13 - 130.99 |
0.699 times |
Fri 19 September 2025 |
130.33 (0.88%) |
129.50 |
128.37 - 130.44 |
1.133 times |
Fri 12 September 2025 |
129.19 (1.49%) |
127.68 |
127.37 - 129.56 |
2.7498 times |
Fri 05 September 2025 |
127.29 (0.41%) |
125.20 |
124.85 - 128.28 |
1.0096 times |
Fri 29 August 2025 |
126.77 (0%) |
127.13 |
126.39 - 127.22 |
0.2473 times |
Fri 29 August 2025 |
126.77 (0.07%) |
126.38 |
126.03 - 127.53 |
1.084 times |
Fri 22 August 2025 |
126.68 (0.4%) |
126.06 |
124.24 - 126.96 |
2.7901 times |
Monthly price and charts GoldmanSachs Strong monthly Stock price targets for GoldmanSachs GSLC are 128.78 and 133.02 | Monthly Target 1 | 125.38 | | Monthly Target 2 | 127.94 | | Monthly Target 3 | 129.62 | | Monthly Target 4 | 132.18 | | Monthly Target 5 | 133.86 |
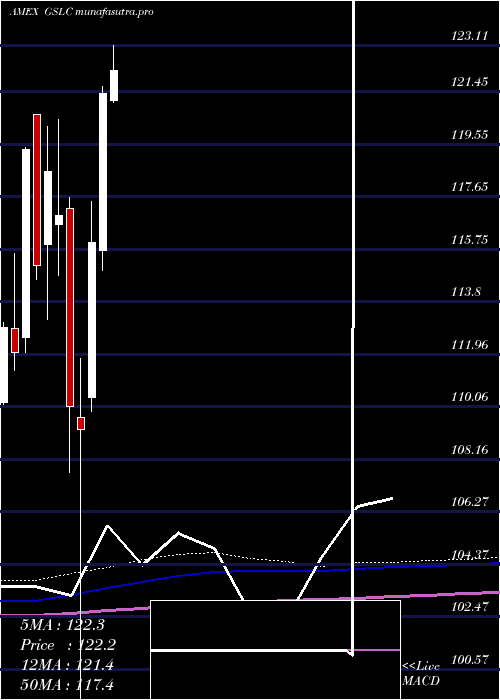
Monthly price and volumes Goldman Sachs
| Date |
Closing |
Open |
Range |
Volume |
Thu 23 October 2025 |
130.50 (0.17%) |
129.70 |
127.06 - 131.30 |
0.5721 times |
Tue 30 September 2025 |
130.28 (2.77%) |
125.20 |
124.85 - 130.99 |
1.2205 times |
Fri 29 August 2025 |
126.77 (2.16%) |
122.90 |
121.60 - 127.53 |
1.3591 times |
Thu 31 July 2025 |
124.09 (2.23%) |
121.13 |
120.99 - 125.64 |
1.4216 times |
Mon 30 June 2025 |
121.38 (4.64%) |
115.71 |
114.98 - 121.65 |
0.7852 times |
Fri 30 May 2025 |
116.00 (6.19%) |
110.39 |
109.87 - 117.48 |
0.7941 times |
Wed 30 April 2025 |
109.24 (-0.76%) |
109.67 |
94.88 - 111.79 |
1.1694 times |
Mon 31 March 2025 |
110.08 (-5.91%) |
117.25 |
107.67 - 117.63 |
0.9476 times |
Fri 28 February 2025 |
116.99 (-1.32%) |
116.67 |
114.79 - 120.46 |
0.7979 times |
Fri 31 January 2025 |
118.55 (2.93%) |
115.92 |
113.22 - 120.21 |
0.9326 times |
Tue 31 December 2024 |
115.18 (-3.52%) |
120.62 |
114.68 - 120.62 |
0.6705 times |
DMA SMA EMA moving averages of Goldman Sachs GSLC
DMA (daily moving average) of Goldman Sachs GSLC
| DMA period | DMA value | | 5 day DMA | 130.07 | | 12 day DMA | 129.53 | | 20 day DMA | 129.85 | | 35 day DMA | 129.55 | | 50 day DMA | 128.59 | | 100 day DMA | 125.08 | | 150 day DMA | 119.93 | | 200 day DMA | 119.04 | EMA (exponential moving average) of Goldman Sachs GSLC
| EMA period | EMA current | EMA prev | EMA prev2 | | 5 day EMA | 130.04 | 129.81 | 129.81 | | 12 day EMA | 129.79 | 129.66 | 129.63 | | 20 day EMA | 129.63 | 129.54 | 129.51 | | 35 day EMA | 129.05 | 128.96 | 128.91 | | 50 day EMA | 128.52 | 128.44 | 128.38 |
SMA (simple moving average) of Goldman Sachs GSLC
| SMA period | SMA current | SMA prev | SMA prev2 | | 5 day SMA | 130.07 | 129.63 | 129.53 | | 12 day SMA | 129.53 | 129.51 | 129.59 | | 20 day SMA | 129.85 | 129.76 | 129.74 | | 35 day SMA | 129.55 | 129.47 | 129.37 | | 50 day SMA | 128.59 | 128.51 | 128.45 | | 100 day SMA | 125.08 | 124.94 | 124.8 | | 150 day SMA | 119.93 | 119.81 | 119.68 | | 200 day SMA | 119.04 | 118.96 | 118.9 |
|
|
