GsAccess GSIG full analysis,charts,indicators,moving averages,SMA,DMA,EMA,ADX,MACD,RSIGs Access GSIG WideScreen charts, DMA,SMA,EMA technical analysis, forecast prediction, by indicators ADX,MACD,RSI,CCI AMEX stock exchange
Daily price and charts and targets GsAccess Strong Daily Stock price targets for GsAccess GSIG are 47.93 and 47.93 | Daily Target 1 | 47.93 | | Daily Target 2 | 47.93 | | Daily Target 3 | 47.93 | | Daily Target 4 | 47.93 | | Daily Target 5 | 47.93 |
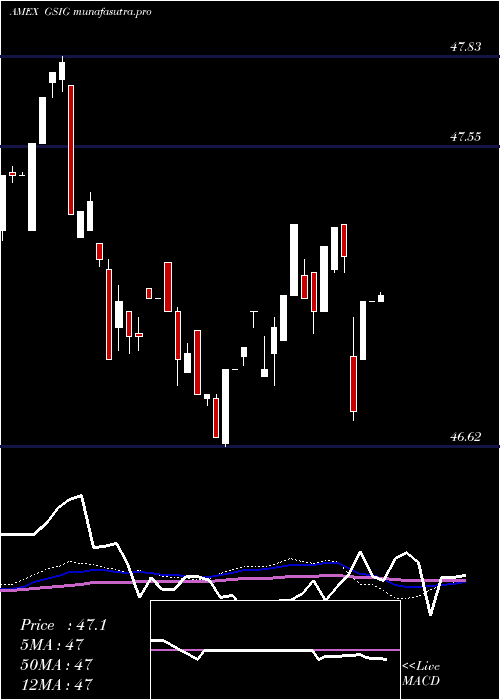
Daily price and volume Gs Access
| Date |
Closing |
Open |
Range |
Volume |
Thu 23 October 2025 |
47.93 (0.04%) |
47.93 |
47.93 - 47.93 |
3.1465 times |
Wed 22 October 2025 |
47.91 (-0.06%) |
47.95 |
47.95 - 47.95 |
0 times |
Tue 21 October 2025 |
47.94 (0.06%) |
47.94 |
47.94 - 47.94 |
0.286 times |
Mon 20 October 2025 |
47.91 (0%) |
47.93 |
47.93 - 47.93 |
0 times |
Fri 17 October 2025 |
47.91 (-0.06%) |
47.91 |
47.89 - 47.91 |
1.1442 times |
Thu 16 October 2025 |
47.94 (0.17%) |
47.87 |
47.87 - 47.94 |
0.8581 times |
Wed 15 October 2025 |
47.86 (0.25%) |
47.88 |
47.86 - 47.88 |
0.5721 times |
Tue 07 October 2025 |
47.74 (0.04%) |
47.73 |
47.73 - 47.74 |
0.5721 times |
Mon 06 October 2025 |
47.72 (-0.04%) |
47.73 |
47.72 - 47.73 |
0.8324 times |
Fri 03 October 2025 |
47.74 (-0.04%) |
47.77 |
47.74 - 47.77 |
2.5887 times |
Thu 02 October 2025 |
47.76 (0.02%) |
47.73 |
47.72 - 47.76 |
20.3089 times |

Weekly price and charts GsAccess Strong weekly Stock price targets for GsAccess GSIG are 47.92 and 47.94 | Weekly Target 1 | 47.92 | | Weekly Target 2 | 47.92 | | Weekly Target 3 | 47.936666666667 | | Weekly Target 4 | 47.94 | | Weekly Target 5 | 47.96 |
Weekly price and volumes for Gs Access
| Date |
Closing |
Open |
Range |
Volume |
Thu 23 October 2025 |
47.93 (0.04%) |
47.93 |
47.93 - 47.95 |
0.3822 times |
Fri 17 October 2025 |
47.91 (0.36%) |
47.73 |
47.72 - 47.94 |
0.4431 times |
Fri 03 October 2025 |
47.74 (-0.08%) |
47.84 |
47.72 - 47.88 |
3.123 times |
Fri 26 September 2025 |
47.78 (-0.21%) |
47.89 |
47.76 - 47.89 |
1.2422 times |
Fri 19 September 2025 |
47.88 (0.06%) |
47.90 |
47.85 - 47.94 |
1.6881 times |
Fri 12 September 2025 |
47.85 (0.02%) |
47.90 |
47.84 - 47.90 |
1.5926 times |
Fri 05 September 2025 |
47.84 (0.08%) |
47.62 |
47.62 - 47.91 |
0.4459 times |
Fri 29 August 2025 |
47.80 (0%) |
47.80 |
47.80 - 47.80 |
0.0319 times |
Fri 29 August 2025 |
47.80 (0.08%) |
47.72 |
47.71 - 47.82 |
0.1911 times |
Fri 22 August 2025 |
47.76 (0.32%) |
47.62 |
47.60 - 47.76 |
0.86 times |
Fri 15 August 2025 |
47.61 (0.19%) |
47.56 |
47.55 - 47.68 |
1.8474 times |
Monthly price and charts GsAccess Strong monthly Stock price targets for GsAccess GSIG are 47.83 and 48.06 | Monthly Target 1 | 47.64 | | Monthly Target 2 | 47.78 | | Monthly Target 3 | 47.866666666667 | | Monthly Target 4 | 48.01 | | Monthly Target 5 | 48.1 |
Monthly price and volumes Gs Access
| Date |
Closing |
Open |
Range |
Volume |
Thu 23 October 2025 |
47.93 (0.17%) |
47.75 |
47.72 - 47.95 |
0.4467 times |
Tue 30 September 2025 |
47.85 (0.1%) |
47.62 |
47.62 - 47.94 |
0.7225 times |
Fri 29 August 2025 |
47.80 (0.7%) |
47.46 |
47.45 - 47.82 |
0.6222 times |
Thu 31 July 2025 |
47.47 (-0.25%) |
47.38 |
47.09 - 47.53 |
2.8334 times |
Mon 30 June 2025 |
47.59 (0.51%) |
47.12 |
47.07 - 47.59 |
3.8925 times |
Fri 30 May 2025 |
47.35 (-0.21%) |
47.20 |
47.01 - 47.35 |
0.2014 times |
Wed 30 April 2025 |
47.45 (0.3%) |
47.17 |
46.70 - 47.45 |
0.1498 times |
Mon 31 March 2025 |
47.31 (0%) |
47.15 |
46.97 - 47.31 |
0.3626 times |
Fri 28 February 2025 |
47.31 (0.57%) |
46.84 |
46.81 - 47.31 |
0.4385 times |
Fri 31 January 2025 |
47.04 (0.53%) |
46.78 |
46.62 - 47.04 |
0.3305 times |
Tue 31 December 2024 |
46.79 (-0.62%) |
47.19 |
46.79 - 47.19 |
0.3318 times |

DMA SMA EMA moving averages of Gs Access GSIG
DMA (daily moving average) of Gs Access GSIG
| DMA period | DMA value | | 5 day DMA | 47.92 | | 12 day DMA | 47.84 | | 20 day DMA | 47.84 | | 35 day DMA | 47.84 | | 50 day DMA | 47.78 | | 100 day DMA | 47.57 | | 150 day DMA | 47.42 | | 200 day DMA | 47.3 | EMA (exponential moving average) of Gs Access GSIG
| EMA period | EMA current | EMA prev | EMA prev2 | | 5 day EMA | 47.91 | 47.9 | 47.9 | | 12 day EMA | 47.88 | 47.87 | 47.86 | | 20 day EMA | 47.86 | 47.85 | 47.84 | | 35 day EMA | 47.84 | 47.83 | 47.82 | | 50 day EMA | 47.8 | 47.79 | 47.78 |
SMA (simple moving average) of Gs Access GSIG
| SMA period | SMA current | SMA prev | SMA prev2 | | 5 day SMA | 47.92 | 47.92 | 47.91 | | 12 day SMA | 47.84 | 47.84 | 47.83 | | 20 day SMA | 47.84 | 47.84 | 47.84 | | 35 day SMA | 47.84 | 47.83 | 47.83 | | 50 day SMA | 47.78 | 47.78 | 47.77 | | 100 day SMA | 47.57 | 47.57 | 47.56 | | 150 day SMA | 47.42 | 47.42 | 47.41 | | 200 day SMA | 47.3 | 47.3 | 47.29 |
|
|
