GoldmanSachs GSIE full analysis,charts,indicators,moving averages,SMA,DMA,EMA,ADX,MACD,RSIGoldman Sachs GSIE WideScreen charts, DMA,SMA,EMA technical analysis, forecast prediction, by indicators ADX,MACD,RSI,CCI AMEX stock exchange
Daily price and charts and targets GoldmanSachs Strong Daily Stock price targets for GoldmanSachs GSIE are 41.31 and 41.49 | Daily Target 1 | 41.17 | | Daily Target 2 | 41.27 | | Daily Target 3 | 41.353333333333 | | Daily Target 4 | 41.45 | | Daily Target 5 | 41.53 |
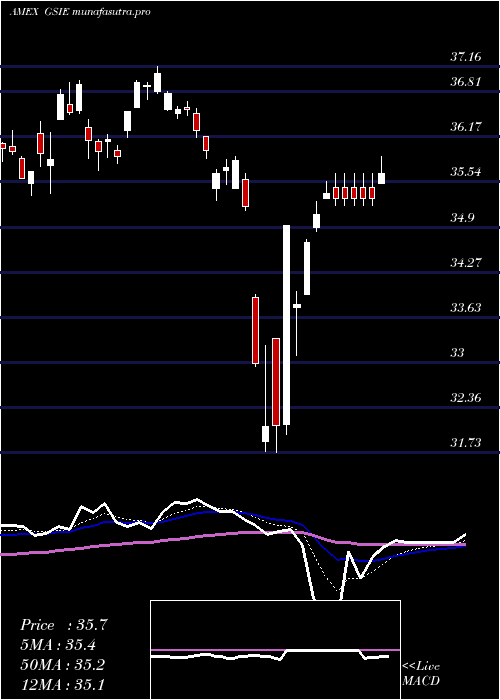
Daily price and volume Goldman Sachs
| Date |
Closing |
Open |
Range |
Volume |
Thu 23 October 2025 |
41.36 (0.51%) |
41.29 |
41.26 - 41.44 |
3.0132 times |
Wed 22 October 2025 |
41.15 (0.1%) |
41.16 |
41.02 - 41.27 |
0.8316 times |
Tue 21 October 2025 |
41.11 (-0.77%) |
41.24 |
41.11 - 41.29 |
0.6943 times |
Mon 20 October 2025 |
41.43 (0.61%) |
41.30 |
41.29 - 41.47 |
0.6902 times |
Fri 17 October 2025 |
41.18 (0.1%) |
41.02 |
40.94 - 41.20 |
0.6837 times |
Thu 16 October 2025 |
41.14 (0.22%) |
41.21 |
41.00 - 41.32 |
0.7329 times |
Wed 15 October 2025 |
41.05 (0.29%) |
41.06 |
40.83 - 41.17 |
0.485 times |
Tue 14 October 2025 |
40.93 (0.61%) |
40.48 |
40.46 - 41.01 |
1.2442 times |
Mon 13 October 2025 |
40.68 (0.67%) |
40.62 |
40.48 - 40.73 |
0.6545 times |
Fri 10 October 2025 |
40.41 (-1.58%) |
41.01 |
40.36 - 41.03 |
0.9704 times |
Thu 09 October 2025 |
41.06 (-0.82%) |
41.43 |
40.95 - 41.43 |
0.6411 times |
Weekly price and charts GoldmanSachs Strong weekly Stock price targets for GoldmanSachs GSIE are 41.19 and 41.64 | Weekly Target 1 | 40.83 | | Weekly Target 2 | 41.1 | | Weekly Target 3 | 41.283333333333 | | Weekly Target 4 | 41.55 | | Weekly Target 5 | 41.73 |
Weekly price and volumes for Goldman Sachs
| Date |
Closing |
Open |
Range |
Volume |
Thu 23 October 2025 |
41.36 (0.44%) |
41.30 |
41.02 - 41.47 |
0.9052 times |
Fri 17 October 2025 |
41.18 (1.91%) |
40.62 |
40.46 - 41.32 |
0.6578 times |
Fri 10 October 2025 |
40.41 (-3%) |
41.19 |
40.36 - 41.79 |
0.6517 times |
Fri 03 October 2025 |
41.66 (2.11%) |
40.97 |
40.89 - 41.75 |
0.9477 times |
Fri 26 September 2025 |
40.80 (-1.21%) |
41.30 |
40.39 - 41.62 |
0.8628 times |
Fri 19 September 2025 |
41.30 (0.02%) |
41.49 |
41.19 - 41.73 |
4.3109 times |
Fri 12 September 2025 |
41.29 (1.25%) |
41.07 |
40.95 - 41.51 |
0.6599 times |
Fri 05 September 2025 |
40.78 (0.42%) |
40.02 |
39.95 - 41.04 |
0.4021 times |
Fri 29 August 2025 |
40.61 (0%) |
40.59 |
40.55 - 40.68 |
0.0768 times |
Fri 29 August 2025 |
40.61 (-1.77%) |
41.15 |
40.38 - 41.21 |
0.5249 times |
Fri 22 August 2025 |
41.34 (1.05%) |
40.82 |
40.67 - 41.41 |
1.5149 times |

Monthly price and charts GoldmanSachs Strong monthly Stock price targets for GoldmanSachs GSIE are 40.86 and 42.29 | Monthly Target 1 | 39.74 | | Monthly Target 2 | 40.55 | | Monthly Target 3 | 41.17 | | Monthly Target 4 | 41.98 | | Monthly Target 5 | 42.6 |
Monthly price and volumes Goldman Sachs
| Date |
Closing |
Open |
Range |
Volume |
Thu 23 October 2025 |
41.36 (0.61%) |
41.32 |
40.36 - 41.79 |
0.7387 times |
Tue 30 September 2025 |
41.11 (1.23%) |
40.02 |
39.95 - 41.73 |
1.6389 times |
Fri 29 August 2025 |
40.61 (4.07%) |
38.90 |
38.69 - 41.41 |
0.8525 times |
Thu 31 July 2025 |
39.02 (-1.61%) |
39.61 |
38.93 - 40.61 |
0.9053 times |
Mon 30 June 2025 |
39.66 (1.25%) |
39.28 |
38.53 - 39.93 |
0.8951 times |
Fri 30 May 2025 |
39.17 (5.15%) |
37.32 |
37.09 - 39.44 |
0.7945 times |
Wed 30 April 2025 |
37.25 (4.49%) |
35.70 |
31.73 - 37.38 |
1.1258 times |
Mon 31 March 2025 |
35.65 (-0.08%) |
36.22 |
35.28 - 37.16 |
1.2612 times |
Fri 28 February 2025 |
35.68 (2.79%) |
34.14 |
34.00 - 36.26 |
0.7481 times |
Fri 31 January 2025 |
34.71 (4.11%) |
33.37 |
32.69 - 35.22 |
1.0399 times |
Tue 31 December 2024 |
33.34 (-2%) |
35.23 |
33.01 - 35.28 |
0.6848 times |

DMA SMA EMA moving averages of Goldman Sachs GSIE
DMA (daily moving average) of Goldman Sachs GSIE
| DMA period | DMA value | | 5 day DMA | 41.25 | | 12 day DMA | 41.08 | | 20 day DMA | 41.16 | | 35 day DMA | 41.18 | | 50 day DMA | 41.05 | | 100 day DMA | 40.33 | | 150 day DMA | 39.12 | | 200 day DMA | 38.15 | EMA (exponential moving average) of Goldman Sachs GSIE
| EMA period | EMA current | EMA prev | EMA prev2 | | 5 day EMA | 41.23 | 41.16 | 41.16 | | 12 day EMA | 41.17 | 41.14 | 41.14 | | 20 day EMA | 41.14 | 41.12 | 41.12 | | 35 day EMA | 41.08 | 41.06 | 41.05 | | 50 day EMA | 41.02 | 41.01 | 41 |
SMA (simple moving average) of Goldman Sachs GSIE
| SMA period | SMA current | SMA prev | SMA prev2 | | 5 day SMA | 41.25 | 41.2 | 41.18 | | 12 day SMA | 41.08 | 41.07 | 41.12 | | 20 day SMA | 41.16 | 41.12 | 41.11 | | 35 day SMA | 41.18 | 41.16 | 41.14 | | 50 day SMA | 41.05 | 41.04 | 41.03 | | 100 day SMA | 40.33 | 40.31 | 40.29 | | 150 day SMA | 39.12 | 39.09 | 39.06 | | 200 day SMA | 38.15 | 38.12 | 38.08 |
|
|
