GoldmanSachs GSID full analysis,charts,indicators,moving averages,SMA,DMA,EMA,ADX,MACD,RSIGoldman Sachs GSID WideScreen charts, DMA,SMA,EMA technical analysis, forecast prediction, by indicators ADX,MACD,RSI,CCI AMEX stock exchange
Daily price and charts and targets GoldmanSachs Strong Daily Stock price targets for GoldmanSachs GSID are 67.59 and 67.75 | Daily Target 1 | 67.55 | | Daily Target 2 | 67.62 | | Daily Target 3 | 67.713333333333 | | Daily Target 4 | 67.78 | | Daily Target 5 | 67.87 |
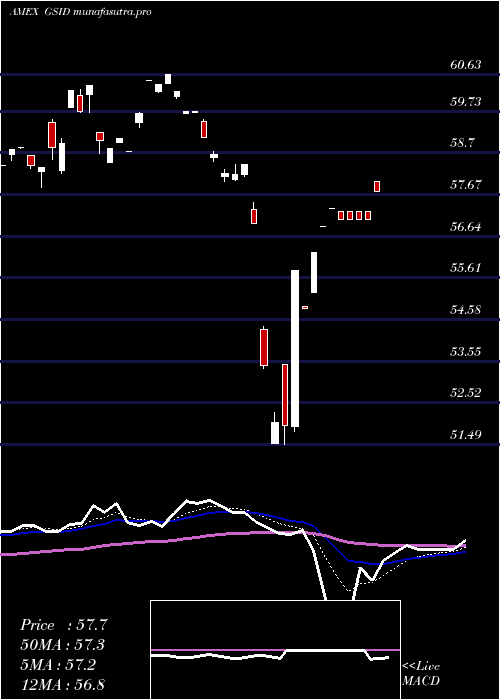
Daily price and volume Goldman Sachs
| Date |
Closing |
Open |
Range |
Volume |
Fri 24 October 2025 |
67.68 (0.01%) |
67.73 |
67.65 - 67.81 |
0.1445 times |
Thu 23 October 2025 |
67.67 (0.42%) |
67.56 |
67.50 - 67.79 |
0.0744 times |
Wed 22 October 2025 |
67.39 (-0.09%) |
67.56 |
67.23 - 67.56 |
8.5661 times |
Tue 21 October 2025 |
67.45 (-0.72%) |
67.59 |
67.45 - 67.62 |
0.0593 times |
Mon 20 October 2025 |
67.94 (0.91%) |
67.99 |
67.94 - 67.99 |
0.0154 times |
Fri 17 October 2025 |
67.33 (0.31%) |
67.33 |
67.33 - 67.33 |
0 times |
Thu 16 October 2025 |
67.12 (0.4%) |
67.18 |
66.95 - 67.44 |
0.0275 times |
Wed 15 October 2025 |
66.85 (0.57%) |
67.05 |
66.79 - 67.05 |
0.0148 times |
Tue 14 October 2025 |
66.47 (0.39%) |
66.47 |
66.47 - 66.47 |
0.0049 times |
Mon 13 October 2025 |
66.21 (0.98%) |
66.10 |
66.06 - 66.31 |
1.0929 times |
Fri 10 October 2025 |
65.57 (-2.09%) |
65.80 |
65.57 - 65.80 |
6.7452 times |
Weekly price and charts GoldmanSachs Strong weekly Stock price targets for GoldmanSachs GSID are 67.08 and 67.84 | Weekly Target 1 | 66.87 | | Weekly Target 2 | 67.28 | | Weekly Target 3 | 67.633333333333 | | Weekly Target 4 | 68.04 | | Weekly Target 5 | 68.39 |
Weekly price and volumes for Goldman Sachs
| Date |
Closing |
Open |
Range |
Volume |
Fri 24 October 2025 |
67.68 (0.52%) |
67.99 |
67.23 - 67.99 |
3.517 times |
Fri 17 October 2025 |
67.33 (2.68%) |
66.10 |
66.06 - 67.44 |
0.4526 times |
Fri 10 October 2025 |
65.57 (-3.3%) |
68.05 |
65.57 - 68.16 |
2.8859 times |
Fri 03 October 2025 |
67.81 (2.73%) |
66.28 |
66.17 - 67.95 |
0.5572 times |
Fri 26 September 2025 |
66.01 (-0.92%) |
66.59 |
65.30 - 66.97 |
0.7322 times |
Fri 19 September 2025 |
66.62 (0.06%) |
67.00 |
66.62 - 67.17 |
0.1355 times |
Fri 12 September 2025 |
66.58 (1.2%) |
66.29 |
66.22 - 66.96 |
0.1708 times |
Fri 05 September 2025 |
65.79 (0.32%) |
65.15 |
64.95 - 65.79 |
0.5124 times |
Fri 29 August 2025 |
65.58 (0%) |
65.70 |
65.50 - 65.70 |
0.0098 times |
Fri 29 August 2025 |
65.58 (-1.75%) |
66.59 |
65.50 - 66.59 |
1.0267 times |
Fri 22 August 2025 |
66.75 (1.12%) |
65.89 |
65.64 - 66.90 |
2.3773 times |

Monthly price and charts GoldmanSachs Strong monthly Stock price targets for GoldmanSachs GSID are 66.63 and 69.22 | Monthly Target 1 | 64.55 | | Monthly Target 2 | 66.11 | | Monthly Target 3 | 67.136666666667 | | Monthly Target 4 | 68.7 | | Monthly Target 5 | 69.73 |
Monthly price and volumes Goldman Sachs
| Date |
Closing |
Open |
Range |
Volume |
Fri 24 October 2025 |
67.68 (1.67%) |
67.11 |
65.57 - 68.16 |
0.8929 times |
Tue 30 September 2025 |
66.57 (1.51%) |
65.15 |
64.95 - 67.17 |
0.2054 times |
Fri 29 August 2025 |
65.58 (4.93%) |
62.56 |
62.56 - 66.90 |
0.4568 times |
Thu 31 July 2025 |
62.50 (-2.37%) |
63.77 |
62.50 - 65.54 |
1.0409 times |
Mon 30 June 2025 |
64.02 (1.41%) |
63.57 |
62.48 - 64.47 |
0.1628 times |
Fri 30 May 2025 |
63.13 (4.73%) |
60.37 |
60.08 - 63.58 |
2.2593 times |
Wed 30 April 2025 |
60.28 (3.59%) |
58.03 |
51.49 - 60.42 |
1.5783 times |
Mon 31 March 2025 |
58.19 (-0.26%) |
59.45 |
58.00 - 60.63 |
0.8792 times |
Fri 28 February 2025 |
58.34 (2.73%) |
55.71 |
55.71 - 59.01 |
0.4546 times |
Fri 31 January 2025 |
56.79 (4.91%) |
53.97 |
53.35 - 57.44 |
2.0697 times |
Tue 31 December 2024 |
54.13 (-1.67%) |
57.18 |
53.72 - 57.18 |
2.4325 times |

DMA SMA EMA moving averages of Goldman Sachs GSID
DMA (daily moving average) of Goldman Sachs GSID
| DMA period | DMA value | | 5 day DMA | 67.63 | | 12 day DMA | 67.05 | | 20 day DMA | 67.13 | | 35 day DMA | 66.87 | | 50 day DMA | 66.54 | | 100 day DMA | 65.18 | | 150 day DMA | 63.28 | | 200 day DMA | 61.87 | EMA (exponential moving average) of Goldman Sachs GSID
| EMA period | EMA current | EMA prev | EMA prev2 | | 5 day EMA | 67.53 | 67.46 | 67.36 | | 12 day EMA | 67.29 | 67.22 | 67.14 | | 20 day EMA | 67.12 | 67.06 | 67 | | 35 day EMA | 66.83 | 66.78 | 66.73 | | 50 day EMA | 66.56 | 66.51 | 66.46 |
SMA (simple moving average) of Goldman Sachs GSID
| SMA period | SMA current | SMA prev | SMA prev2 | | 5 day SMA | 67.63 | 67.56 | 67.45 | | 12 day SMA | 67.05 | 67.04 | 67.02 | | 20 day SMA | 67.13 | 67.05 | 66.94 | | 35 day SMA | 66.87 | 66.82 | 66.76 | | 50 day SMA | 66.54 | 66.51 | 66.47 | | 100 day SMA | 65.18 | 65.14 | 65.1 | | 150 day SMA | 63.28 | 63.23 | 63.19 | | 200 day SMA | 61.87 | 61.8 | 61.74 |
|
|
