SP GSG full analysis,charts,indicators,moving averages,SMA,DMA,EMA,ADX,MACD,RSIS P GSG WideScreen charts, DMA,SMA,EMA technical analysis, forecast prediction, by indicators ADX,MACD,RSI,CCI AMEX stock exchange
Daily price and charts and targets SP Strong Daily Stock price targets for SP GSG are 23.17 and 23.33 | Daily Target 1 | 23.14 | | Daily Target 2 | 23.19 | | Daily Target 3 | 23.296666666667 | | Daily Target 4 | 23.35 | | Daily Target 5 | 23.46 |
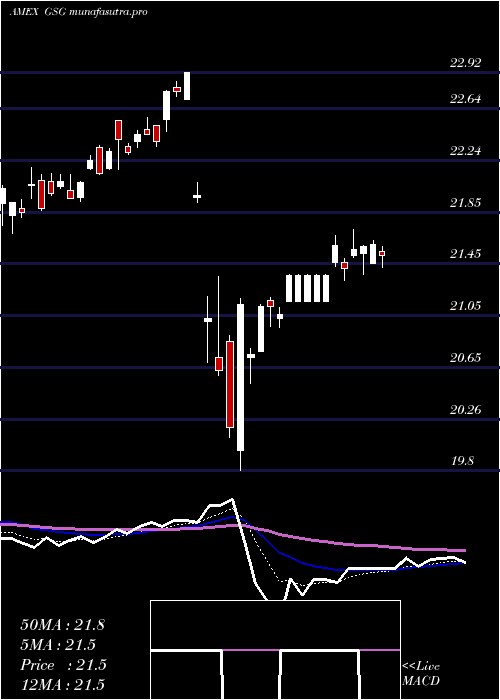
Daily price and volume S P
| Date |
Closing |
Open |
Range |
Volume |
Fri 24 October 2025 |
23.25 (-0.43%) |
23.39 |
23.24 - 23.40 |
3.4239 times |
Thu 23 October 2025 |
23.35 (1.88%) |
23.30 |
23.30 - 23.47 |
0.5108 times |
Wed 22 October 2025 |
22.92 (1.42%) |
22.76 |
22.71 - 22.98 |
0.8782 times |
Tue 21 October 2025 |
22.60 (-0.4%) |
22.57 |
22.43 - 22.67 |
1.7686 times |
Mon 20 October 2025 |
22.69 (0.84%) |
22.50 |
22.50 - 22.69 |
0.2271 times |
Fri 17 October 2025 |
22.50 (-0.18%) |
22.55 |
21.50 - 22.55 |
0.6756 times |
Thu 16 October 2025 |
22.54 (-0.22%) |
22.62 |
22.47 - 22.73 |
0.5082 times |
Wed 15 October 2025 |
22.59 (0.31%) |
22.64 |
22.49 - 22.68 |
0.5719 times |
Tue 14 October 2025 |
22.52 (-1.01%) |
22.47 |
22.43 - 22.61 |
0.9363 times |
Mon 13 October 2025 |
22.75 (1.34%) |
22.70 |
22.63 - 22.78 |
0.4995 times |
Fri 10 October 2025 |
22.45 (-2.09%) |
22.70 |
22.37 - 22.78 |
1.7259 times |
Weekly price and charts SP Strong weekly Stock price targets for SP GSG are 22.84 and 23.88 | Weekly Target 1 | 22.01 | | Weekly Target 2 | 22.63 | | Weekly Target 3 | 23.05 | | Weekly Target 4 | 23.67 | | Weekly Target 5 | 24.09 |
Weekly price and volumes for S P
| Date |
Closing |
Open |
Range |
Volume |
Fri 24 October 2025 |
23.25 (3.33%) |
22.50 |
22.43 - 23.47 |
1.191 times |
Fri 17 October 2025 |
22.50 (0.22%) |
22.70 |
21.50 - 22.78 |
0.5583 times |
Fri 10 October 2025 |
22.45 (-1.32%) |
22.88 |
22.37 - 23.25 |
0.7661 times |
Fri 03 October 2025 |
22.75 (-2.4%) |
23.12 |
22.60 - 23.15 |
2.8334 times |
Fri 26 September 2025 |
23.31 (2.64%) |
22.62 |
22.57 - 23.46 |
0.5732 times |
Fri 19 September 2025 |
22.71 (-0.22%) |
22.92 |
22.70 - 23.27 |
0.5129 times |
Fri 12 September 2025 |
22.76 (0.93%) |
22.72 |
22.59 - 22.94 |
0.718 times |
Fri 05 September 2025 |
22.55 (-0.97%) |
22.91 |
22.48 - 23.13 |
2.4579 times |
Fri 29 August 2025 |
22.77 (0%) |
22.74 |
22.70 - 22.79 |
0.0552 times |
Fri 29 August 2025 |
22.77 (0.89%) |
22.66 |
22.47 - 22.79 |
0.334 times |
Fri 22 August 2025 |
22.57 (1.99%) |
22.02 |
21.97 - 22.60 |
0.2708 times |

Monthly price and charts SP Strong monthly Stock price targets for SP GSG are 22.38 and 24.35 | Monthly Target 1 | 20.77 | | Monthly Target 2 | 22.01 | | Monthly Target 3 | 22.74 | | Monthly Target 4 | 23.98 | | Monthly Target 5 | 24.71 |
Monthly price and volumes S P
| Date |
Closing |
Open |
Range |
Volume |
Fri 24 October 2025 |
23.25 (1.22%) |
22.81 |
21.50 - 23.47 |
0.8418 times |
Tue 30 September 2025 |
22.97 (0.88%) |
22.91 |
22.48 - 23.46 |
1.1195 times |
Fri 29 August 2025 |
22.77 (-0.13%) |
22.83 |
21.93 - 22.85 |
0.5705 times |
Thu 31 July 2025 |
22.80 (3.45%) |
22.10 |
22.05 - 23.13 |
0.8085 times |
Mon 30 June 2025 |
22.04 (4.11%) |
21.70 |
21.49 - 23.66 |
1.3561 times |
Fri 30 May 2025 |
21.17 (2.02%) |
20.76 |
20.65 - 21.84 |
0.8181 times |
Wed 30 April 2025 |
20.75 (-8.87%) |
22.80 |
19.86 - 22.92 |
1.7423 times |
Mon 31 March 2025 |
22.77 (2.61%) |
22.22 |
21.68 - 22.78 |
0.958 times |
Fri 28 February 2025 |
22.19 (-1.47%) |
22.62 |
22.12 - 23.20 |
1.0014 times |
Fri 31 January 2025 |
22.52 (3.45%) |
21.98 |
21.88 - 23.32 |
0.7837 times |
Tue 31 December 2024 |
21.77 (2.93%) |
21.15 |
21.10 - 21.81 |
0.3242 times |

DMA SMA EMA moving averages of S P GSG
DMA (daily moving average) of S P GSG
| DMA period | DMA value | | 5 day DMA | 22.96 | | 12 day DMA | 22.76 | | 20 day DMA | 22.83 | | 35 day DMA | 22.88 | | 50 day DMA | 22.79 | | 100 day DMA | 22.61 | | 150 day DMA | 22.22 | | 200 day DMA | 22.3 | EMA (exponential moving average) of S P GSG
| EMA period | EMA current | EMA prev | EMA prev2 | | 5 day EMA | 23.03 | 22.92 | 22.71 | | 12 day EMA | 22.89 | 22.82 | 22.72 | | 20 day EMA | 22.86 | 22.82 | 22.76 | | 35 day EMA | 22.79 | 22.76 | 22.73 | | 50 day EMA | 22.76 | 22.74 | 22.72 |
SMA (simple moving average) of S P GSG
| SMA period | SMA current | SMA prev | SMA prev2 | | 5 day SMA | 22.96 | 22.81 | 22.65 | | 12 day SMA | 22.76 | 22.75 | 22.72 | | 20 day SMA | 22.83 | 22.83 | 22.83 | | 35 day SMA | 22.88 | 22.86 | 22.84 | | 50 day SMA | 22.79 | 22.77 | 22.75 | | 100 day SMA | 22.61 | 22.6 | 22.57 | | 150 day SMA | 22.22 | 22.22 | 22.21 | | 200 day SMA | 22.3 | 22.29 | 22.29 |
|
|
